2 minutos de lectura
12/06/2019
El blog científico Mind The Graph pretende ayudar a los científicos a aprender a comunicar la ciencia de forma sencilla.
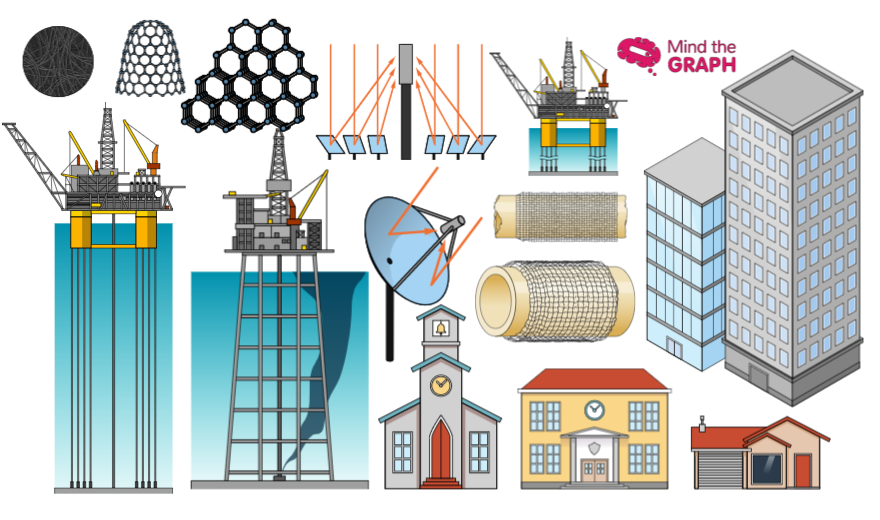
Hola a todos. Como ya sabéis, el viernes es el día de compartir las nuevas ilustraciones científicas. Esta semana hemos añadido varias ilustraciones exclusivas disponibles para todos los usuarios de mind the graph (usuarios gratuitos incluidos). Estas ilustraciones son una pequeña muestra de nuestra biblioteca completa. Hemos creado la mayor base de datos en línea sobre ilustraciones científicas. Así que, comprueba [...]
Durante los días 24 y 25 de octubre de 2019, se celebró en el Sindicato de Empresas [...]
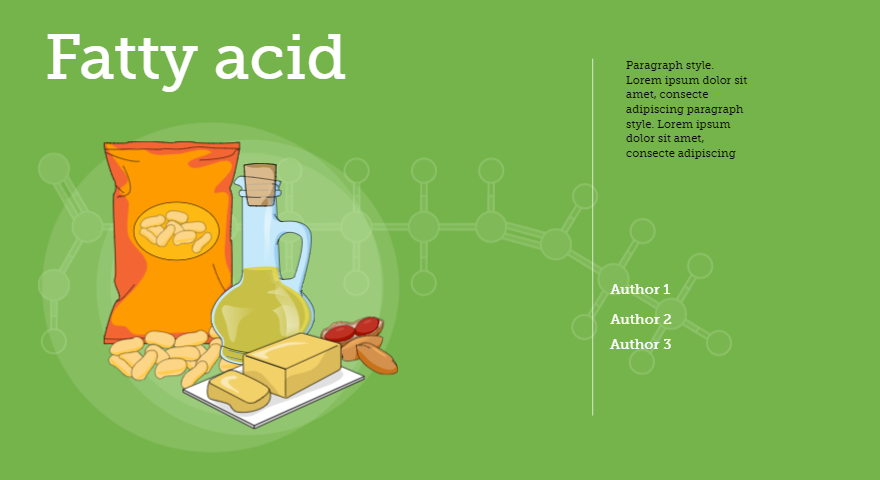
Hoy tenemos una autora invitada - Maryam Kamal - que es una diseñadora de fuentes [...]
¡Hola! ¡Espero que estés disfrutando de tu sexta semana! Estoy aquí para contar con buenas noticias: tenemos muchas [...]
¡Hola de nuevo! Como ya sabéis, cada semana añadimos nuevas ilustraciones a nuestra biblioteca. [...]
Descubra cómo crear un resumen gráfico eficaz. Esta guía le ayudará a elaborar un resumen visual convincente para mejorar el impacto de la investigación.
Hola a todos. ¿Estáis emocionados por el fin de semana? Nosotros también. Además, el viernes es el [...]
Hola, ¡hoy traigo buenas noticias! Como ya sabréis, ofrecemos infografías y [...]
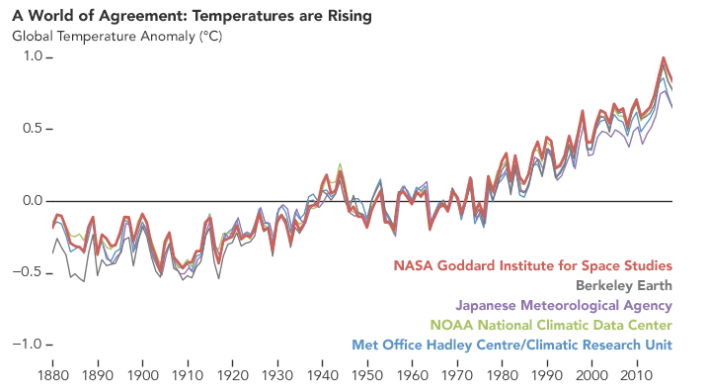
El cambio climático sigue siendo un tema controvertido. A veces las evidencias científicas se desvanecen frente a opiniones personales y [...]
¡Olé! Es la sexta semana de nuevo. Antes de hablar de las expectativas para el fin de semana, [...]
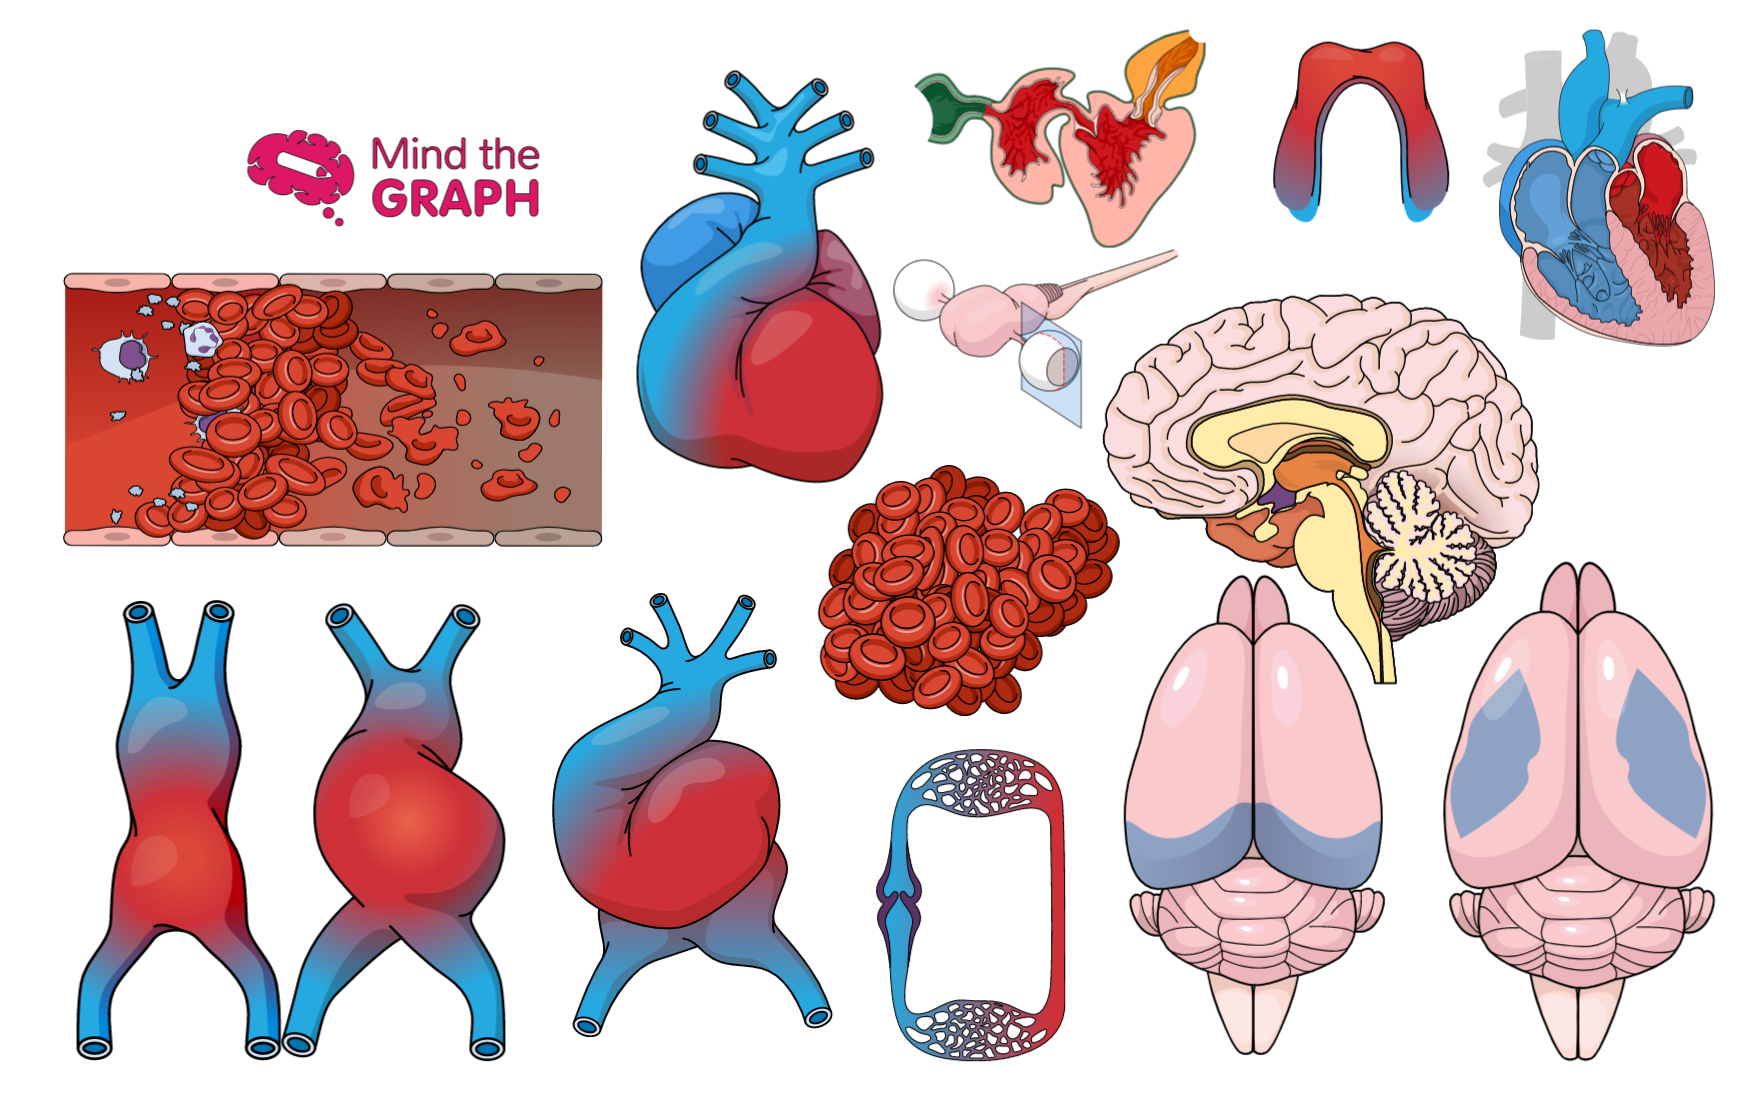
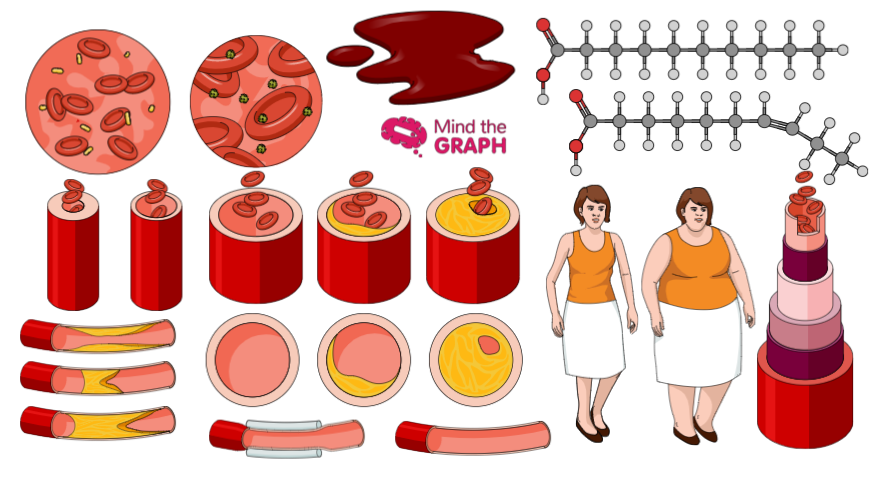
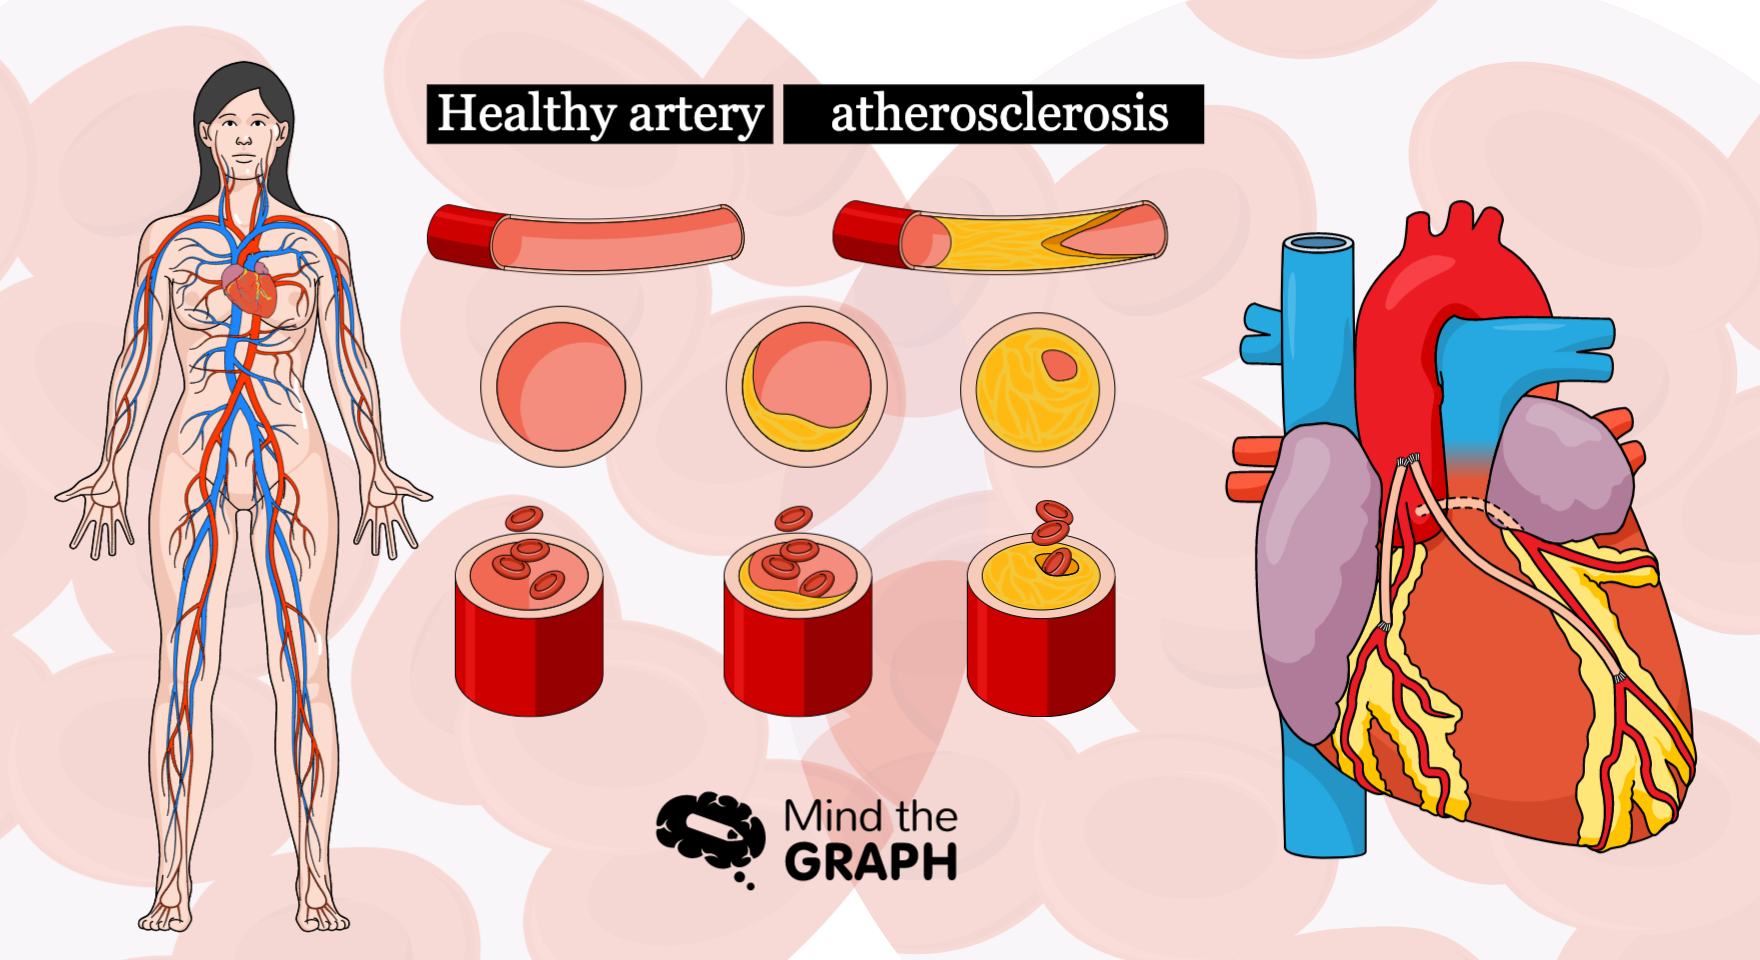
La aterosclerosis es una enfermedad del sistema circulatorio. Se produce cuando la placa se acumula en el interior [...]
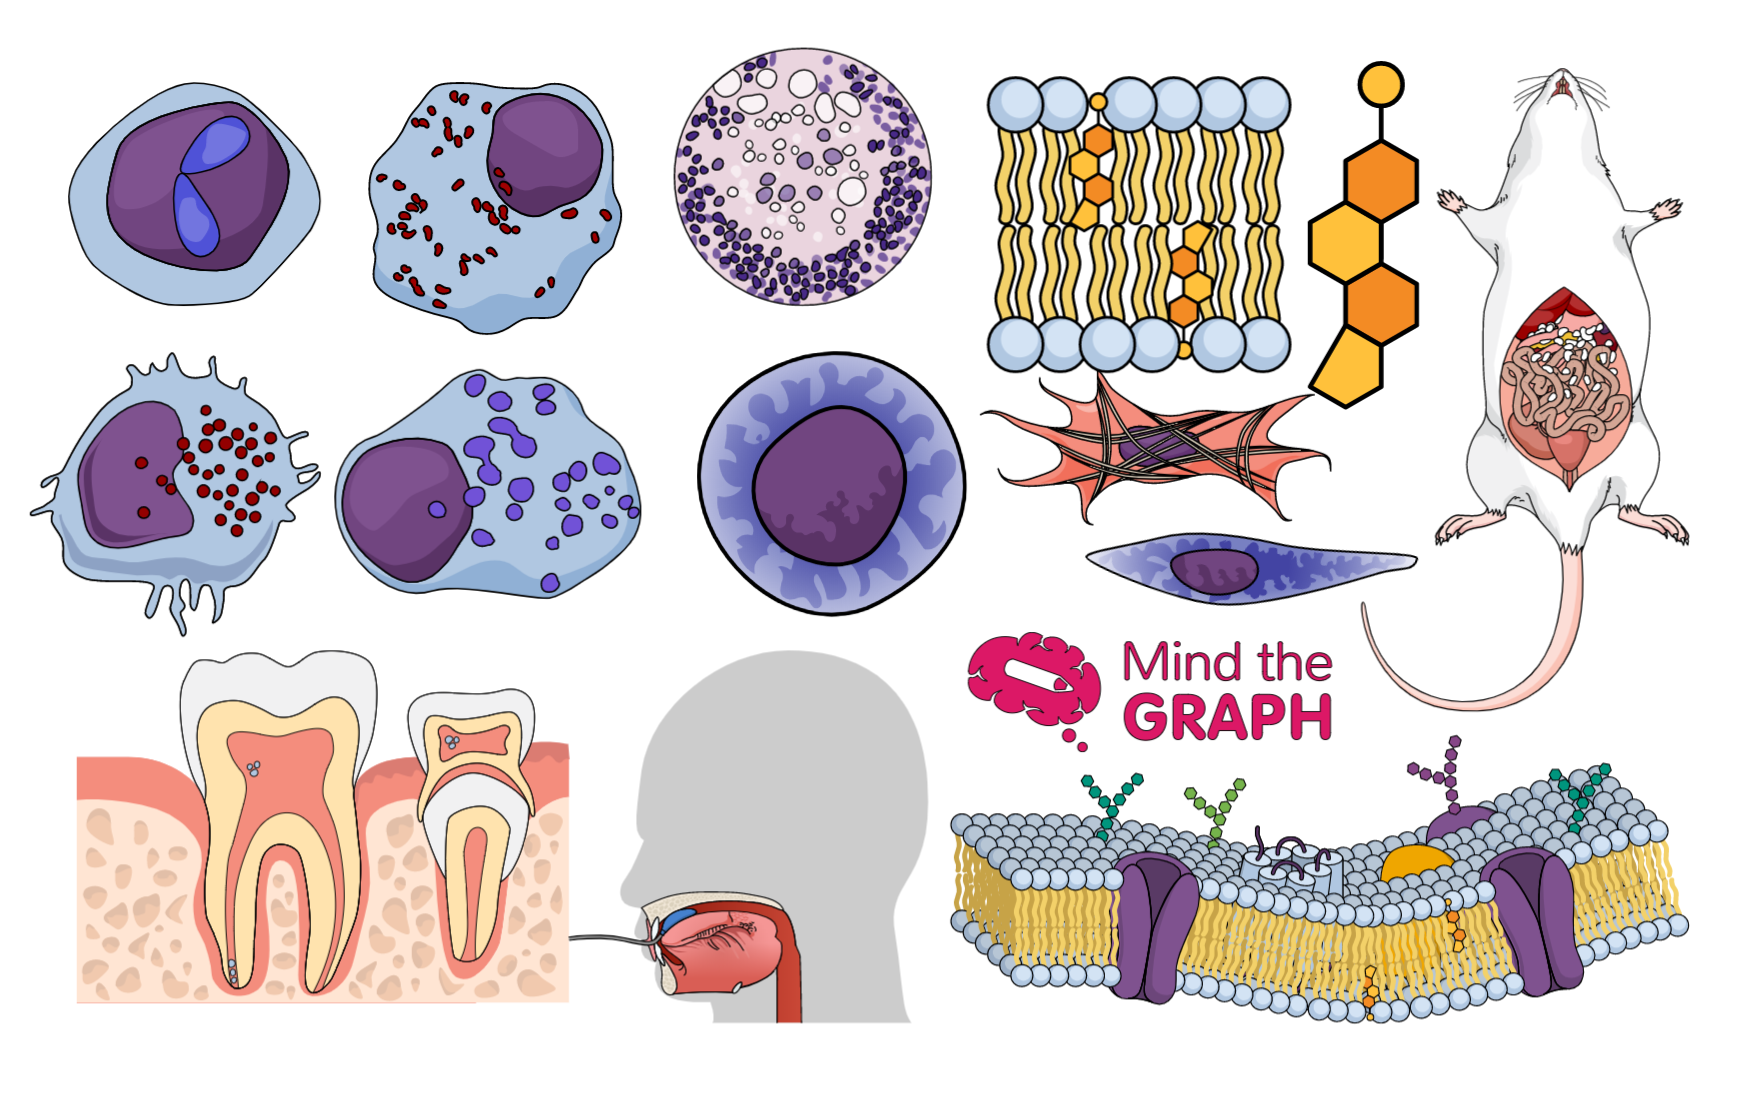
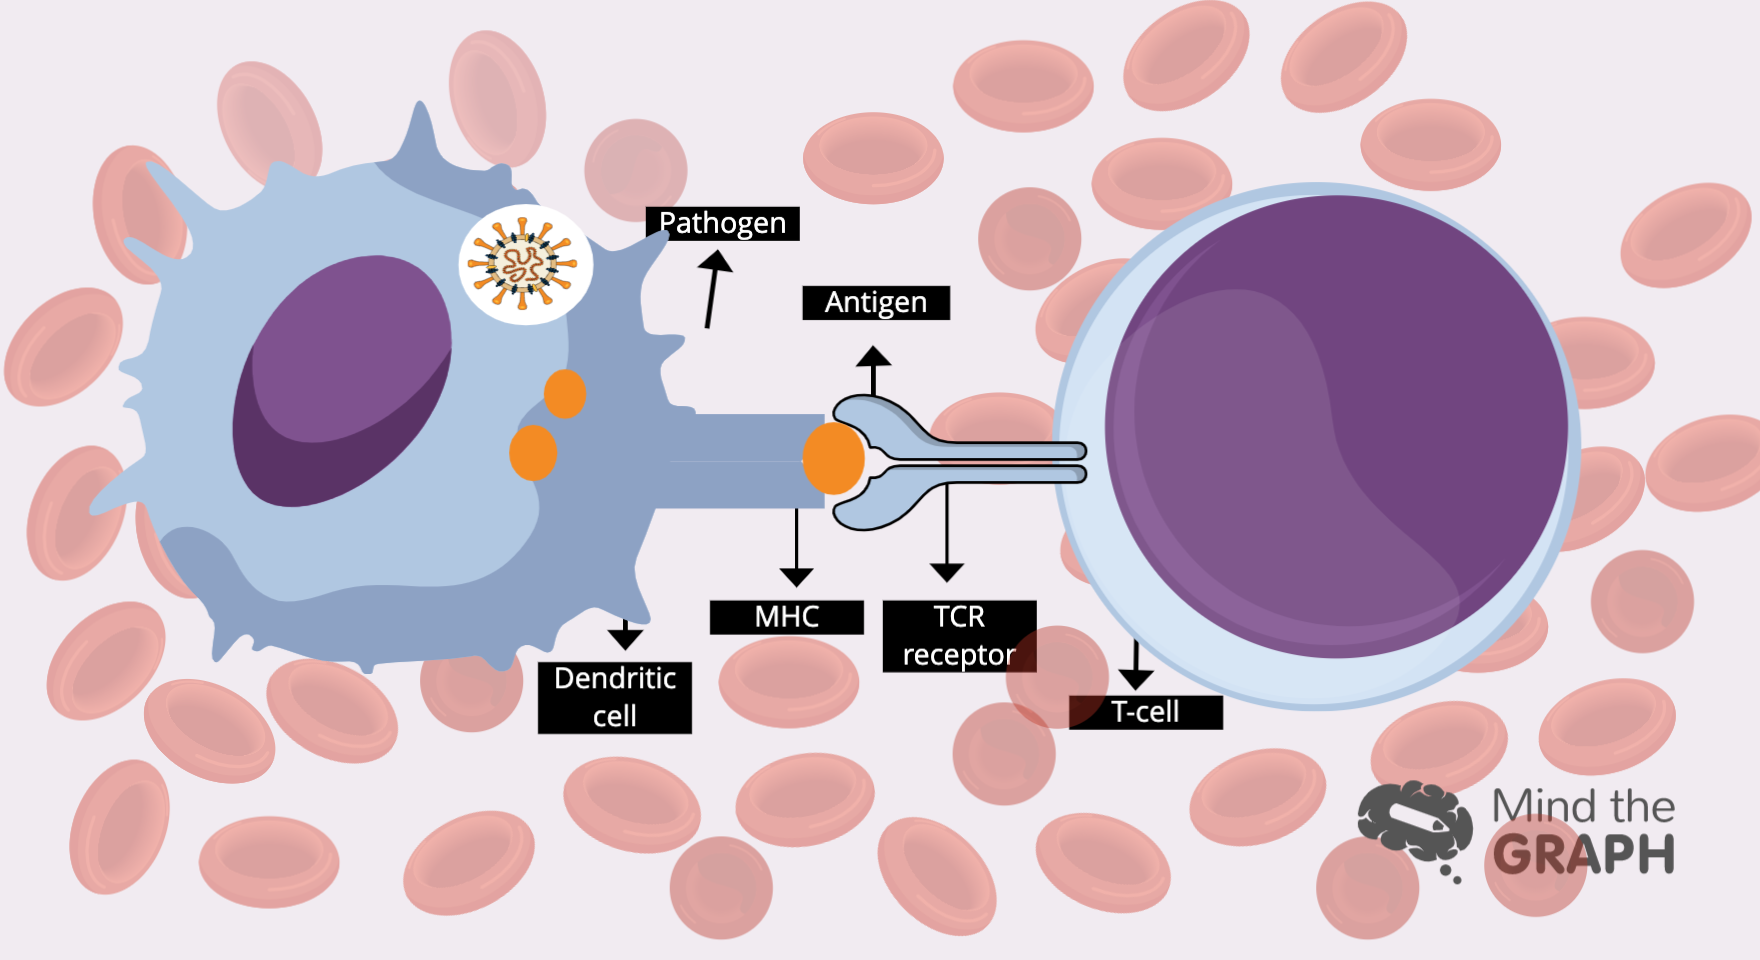
Los glóbulos blancos son responsables de defender nuestro cuerpo contra las amenazas, manteniéndonos vivos. Pero como [...]
¡Hola! Hoy es el día de mostrar lo mejor de nuestra semana. Como ya sabéis, [...]