
A scientific poster is an important and widely used format for sharing research in academic settings, particularly at conferences, workshops, and symposia. Unlike journal articles or oral presentations, a poster is a highly visual medium for summarizing complex ideas in a concise, accessible way. It allows researchers to communicate their work beyond words by integrating text, figures, charts, and images into a single, engaging layout.
Effective visualization is central to research communication. Visual elements help audiences process information faster and remember it longer. Well‑designed visuals can make otherwise dense data approachable. What is more, engaging visualizations spark discussions and invite useful feedback.
A scientific poster condenses months or years of investigation into a format that foregrounds clarity and creativity, while encouraging direct interaction between researcher and audience. An engaging and dynamic conference poster presentation has the power to infuse life into static information, transforming your work into a conversation starter or even a networking tool!
In this article, you will learn how to make a poster presentation, see actual research poster examples, and get to know about scientific poster software.
What is a Poster?
Simply put, a poster is a visual summary of a research project designed to communicate seminal findings, methods, and insights in an attractive and accessible way. During poster sessions, researchers stand by their displays to interact directly with attendees and answer questions, turning the poster into both an informational tool and a springboard for dialog and networking.
What are Scientific and Research Posters?
Although academic conferences can be traced back to 1860, with the first international scientific conference held in Germany, poster sessions did not emerge until a century later. The conference poster presentation concept appears to have begun in Europe before making its way across the Atlantic to North America at the 1974 Biochemistry/Biophysics Meeting in Minneapolis. The American Chemical Society adopted poster sessions for their fall national conference in Chicago in 1975.
Scientific and research posters are visual representations of research or scientific work presented at scholarly conferences or symposiums. They are a handy and powerful means for knowledge dissemination and research networking within academic communities.
Both scientific and research posters incorporate a mix of brief text with tables, graphs, figures, infographics, charts, and images to convey major findings, data, and the significance of the research. Figures and tables are often the main focus, as they can describe research in detail with minimal text. Further, both scientific and research posters are organized to present research as a logical, coherent story. Common sections include a title, authors, abstract, introduction, materials and methods, results, discussion, conclusions, citations, and acknowledgements.
While both types of posters serve as communication tools, a scientific poster is usually focused on the visual presentation of scientific research or experiments, often with standardized sections and an emphasis on data visualization. Research posters, more broadly, may summarize studies across various fields and sometimes include theoretical or review work.
What makes a great Scientific Poster?
Let’s look at how to create a scientific poster that really stands out. A great scientific poster is visually engaging and clear, effectively communicating salient findings to a diverse audience. Think of it as a hybrid between a published paper and an oral presentation. Here are some ways to take a poster from good to great:
- Have a clear and focused narrative: Make your main message(s) stand out. Structure and organize your content clearly and logically
- Verwenden Sie minimal text: The fewer the words the better.
- Describe the direction and magnitude of associations clearly: Show, don’t tell!
- Verwenden Sie formatting, fonts, and white space to your advantage: Get creative!
- Make it interactive: Adding interactive elements like hidden informational panels, attached objects, or props will make the poster engaging and memorable. Here is a scientific poster example with a cool interactive feature.
Poster Design Basics
Now, let’s get down to the design essentials of how to create a scientific poster.
Layout
A scientific poster has an organized and simple design with a consistent layout. Content should fall into logical sections that flow clearly from one to the next, creating a visual path for the reader. Direction of reading is typically top to bottom and left to right. A poster might therefore even have a visual shaped like an “M.” Place your content strategically, while utilizing symmetry and white space smartly. Using a grid can help structure your layout evenly. In this way, text and images can be aligned properly.
Standard sizes
The standard size of a scientific poster is 36 × 48 inches, typically in portrait orientation. The poster should use easy-to-read fonts, with sans serif fonts preferred. Use varying font sizes (24–48 pt) to differentiate between the title, body text, headings, and highlights. The title should be readable from about 10 feet away (at least 40 pt), section headings 30–40 pt, and body text/captions 24–30 pt. Avoid font sizes smaller than 20 pt for most sections, except for references and acknowledgements
Color schemes
Your poster should follow a visually appealing and easy-to-read color scheme, with high-contrast colors to highlight important information. A cohesive color scheme, perhaps inspired by a key image, can reduce clutter. Use clear, white, or pastel backgrounds.
High-quality visuals
Figures and tables should be the main focus, serving as informative visuals that help tell the story. For photographs or illustrations, use high-quality, high-resolution images (ideally 300 DPI, saved in PNG or TIFF formats). Avoid using blown-up photos as poster backgrounds.
Parts of a Scientific Poster
Common sections in a scientific poster are as follows:
- Titel: The first part is a short, attention-grabbing title, which should be readable from a distance.
- Introduction/Background: The background and a clear research question or hypothesis appears as the next part of the scientific poster.
- Methods: A brief explanation of the methodology should be provided. Too much detail is not required.
- Results: Important findings are presented visually, using graphs and tables with legends and titles.
- Discussion: This is where the findings are concisely interpreted, and implications are highlighted.
- Schlussfolgerung: This can be combined with the discussion. This section summarizes the research and its significance.
- Referenzen: A list of the cited literature should be provided, but it should not be too long.
- Acknowledgments: If applicable, this is where authors can thank non-author contributors.
An additional, optional part of scientific posters might be a resource link or QR code to access additional materials.
Research Poster Examples
Compelling scientific posters have the power to grab the attention of academic stalwarts and industry leaders, leading to collaboration opportunities and career progression. “Best Poster Awards” often carry cash prizes too!
With a plethora of tools and resources available today, you can amp up the quality and impact of your posters. For example, a university research lab used Mind the Graph (MTG) to create eye-catching conference posters that effectively presented complex data and drew significant attention. In another case, independent researchers used the platform’s scientific illustrations for a science fair poster that successfully communicated their findings to audiences ranging from scientists to the general public, ultimately winning the Best Poster Award.
Let’s look at some scientific poster examples (templates and layouts) that might inspire your next poster!
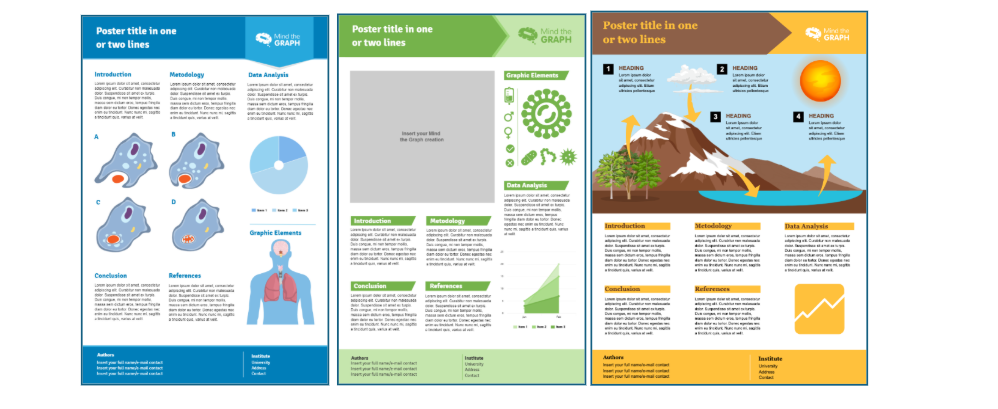
Browse hier for more research poster examples.
How to Create a Scientific Poster
Wondering how to make a scientific poster or where to get started? Here’s a handy checklist with key steps:
1. Plan and brainstorm
Spend time narrowing your focus down to the main message and main findings of your research. Think of the pertinent data, stories, or visuals that will make your poster engaging.
2. Put your data and information together
Organize all your research outputs (figures, tables, methods, results, and conclusions) and ensure that visuals and summaries are complete before outlining the final.
3. Outline the content
Draft a logical structure: group related information and plan which elements will be visual versus narrative.
4. Put it all together
Start designing your scientific poster on your chosen software or template. You can use tools like Mind the Graph, which offer numerous template options and galleries with professional and customizable illustrations. Insert the content into well-defined blocks, add figures/tables, and use coherent color schemes, fonts, and layouts.
5. Review and feedback
Share your draft with colleagues or mentors for input on clarity, flow, and impact. Collect suggestions for improving scientific accuracy, accessibility, and aesthetics, and edit your draft accordingly.
6. Test print
Do a trial print (at a reduced size) to check if all elements are legible and well formatted. Assess color quality, scaling, and possible layout issues.
7. Proofread!
Scrutinize every part of your poster for typos, grammatical errors, and factual inconsistencies. Double-check names, affiliations, and reference formatting for professional presentation.
8. Final print
After final adjustments, print the poster at full scale following the conference specifications for size and format. Use high-resolution files and quality printing materials for a polished result.
Key Considerations when Creating a Scientific Poster
Here are some important tips academics should keep in mind when creating posters:
- Focus on the core message and maintain a clear narrative in your research poster.
- Tailor your poster to the expected audience’s level of knowledge about your topic. Provide sufficient background and translate complex information appropriately.
- Use minimal text. Summarize sections with bullet points and short sentences. Aim for approximately 300-800 words, allowing an average person to read it in about 5 minutes.
- Check the specific requirements of the event or conference.
- Pay careful attention to design elements, color scheme, fonts, figures, and tables.
- Test your poster with your peers and supervisor and incorporate the feedback received.
Tips for a Winning Poster Design
Did you know that many conferences have “Best Poster Awards”? Now, wouldn’t you like your research poster to win a prize? Here are some practical tips that will make your poster shine!
1. Balance visuals with text: Aim for a visually engaging poster by maintaining generous white space and balancing striking images or graphics with concise, supporting text. Avoid dense blocks of writing.
2. Avoid excessive jargon: Limit technical jargon or acronyms to ensure your work is accessible to both specialists and non-specialists.
3. Use tables and charts smartly: Charts are preferred for conveying numeric patterns, relative sizes, comparative outcomes, or trends, reducing the need for extensive text. Provide charts with clear, large titles and succinct annotations explaining patterns. Simplified tables can replace large, detailed statistical tables.
4. Use high-resolution images: All images, diagrams, and icons should be crisp and high-resolution (at least 300 DPI) to prevent pixelation or blurriness on large posters.
5. Avoid clutter: Use margins and padding between sections. Eliminate redundant text, unnecessary logos, or decorative elements that do not support your main message.
6. Get creative: Consider experimenting with design elements and layouts and adding interactive elements.
Tools for Making Scientific Posters
You can choose from a wide and ever-growing list of tools to create a scientific poster: Mind the Graph (suitable for scholarly posters), Microsoft PowerPoint, Google Slides (often free), Adobe Illustrator (for high-quality graphics), Canva (user-friendly web-based), LaTeX (for scientific publications), Mac Pages, and Inkscape (free vector design).
Let’s break down the pros and cons of some of these scientific poster software:
Mind the Graph
Profis
- Largest gallery of accurate scientific illustrations
- Easy-to-use interface, with drag-and-drop feature
- Templates well suited for academic research posters
- Editable graphics, including color, scale, position, etc.
- High-quality, accurate graphics as final output
Nachteile
- Limited free version
- Subscription required for full features
Canva
Profis
- User-friendly
- Collaborative features for team projects
Nachteile
- Premium features require subscription
- Limited scientific-specific templates
- Too generic for academic purposes
PowerPoint
Profis
- Widely available and familiar for most users
- No additional cost if one has MS Office
- Offline functionality
Nachteile
- Limited design capability for posters
- Challenging to create professional-looking posters for academic purposes
Adobe Illustrator
Profis
- Professional-grade design capabilities
- High-quality vector graphics
Nachteile
- Expensive subscription
- Steep learning curve
How to ace your Scientific Poster Presentation
We have carefully deciphered all the dos and don’ts of scientific poster making. But acing poster-making is not enough. You also need to know how to make a poster presentation impressive and memorable.
You should be prepared to verbally explain your work with a brief oral synopsis of your objectives, main findings, and implications. You could even prepare a few questions to ask viewers to encourage dialog. A good practice is to provide handouts with additional technical details, full results, and contact information.
Your scientific poster might be your first presentation or publication. And so, it could well be the first step into the academic spotlight. Make the most of the opportunity to leave a lasting impression!
Häufig gestellte Fragen
Q. What are the different types of scientific posters?
A. Scientific posters generally fall into two main formats: physical posters (printed and pinned at events) and e-posters (digital versions displayed on screens). Both can be static (single-page or slides) or dynamic (including animations and videos). Within posters, common styles include traditional research posters and infographic-style posters for outreach.
Q. How to make a poster presentation for conferences?
A. For your conference poster presentation, (i) focus on clarity; (ii) highlight major findings; (iii) prepare your verbal summary (practice a 3–5-minute overview for conversation and questions); and (iv) stand by your poster, invite questions, and remain enthusiastic about your research.
Q. How to decide the layout of your wissenschaftliches Poster?
A. When deciding the layout of your poster, ensure logical flow (use columns and group information into sections—title, authors, introduction, methods, results, and conclusion), maintain visual hierarchy (keep important findings prominent, and maintain white space for readability), while maintaining consistency and adhering to the conference guidelines.
Mind the Graph is an easy-to-use visualization platform for researchers and scientists that enables fast creation of precise publication-ready graphical abstracts, infographics, posters, and slides. With 75,000+ scientifically accurate illustrations made by experts and hundreds of templates across 80+ major research fields, you can produce polished visuals in minutes — no design skills required.

Abonnieren Sie unseren Newsletter
Exklusive, qualitativ hochwertige Inhalte über effektive visuelle
Kommunikation in der Wissenschaft.