
Learn the art of visual communication through scholarly posters. Discover effective strategies for maximizing impact in academic research presentations.
In today’s world of research and academia, the power of visual communication cannot be underestimated. Scholarly posters, in particular, have emerged as a valuable tool in enhancing the impact of research. These posters serve as a visually appealing and concise summary of a research study, allowing researchers to showcase their findings in a captivating way. With the advancement of technology, platforms like MindtheGraph.com have made it easier for scientists and researchers to create visually stunning scientific posters, even without specialized design skills. By offering a user-friendly interface and a vast library of scientifically accurate illustrations, Mind the Graph aims to make your scientific poster communication more accessible and engaging. Whether you are an individual researcher, part of a small lab, or a large organization, utilizing scholarly posters can greatly enhance the way you present your research and captivate your audience.
Understanding Visual Communication in Research
The Importance of Visuals in Scientific Communication
Visuals play a critical role in scientific communication. They not only add aesthetic appeal but also enhance the comprehension of complex scientific data. A well-designed visual can succinctly communicate a large volume of important information, making it easier for the audience to grasp the essence of the research. Visuals also serve as a powerful tool to draw attention and engage the audience, which is particularly beneficial in a research setting where complex concepts and data are involved. The use of visuals in scientific communication can significantly increase the impact and reach of research. Scholarly posters, as a form of visual communication, are increasingly being recognized for their value in effectively disseminating research findings. In the next subsection, we will explore how visual communication is rooted in scholarly posters.
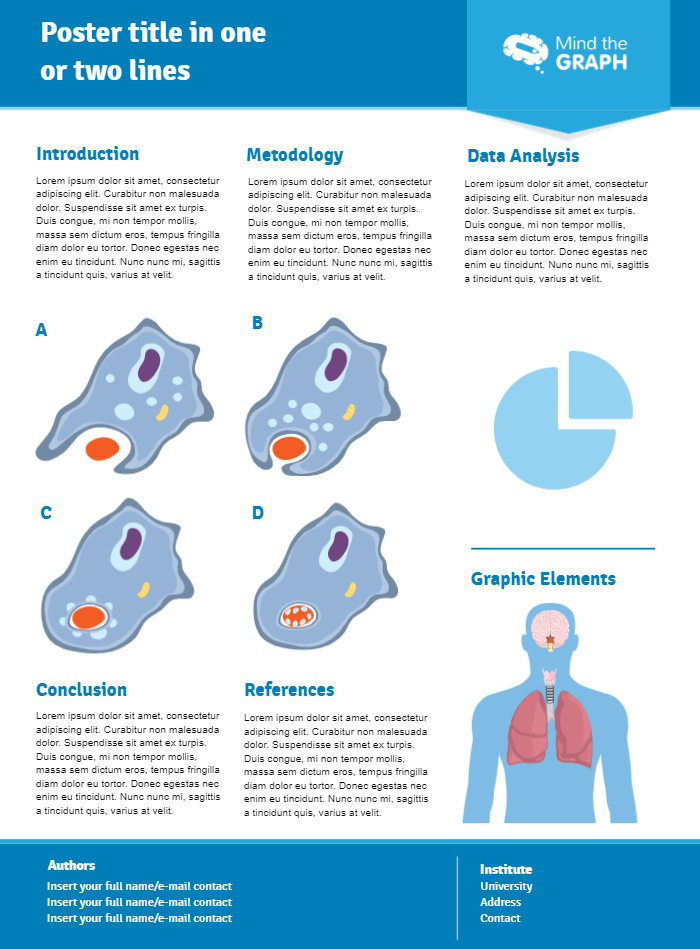
Rooting Visual Communication in Scholarly Posters
Scholarly posters are a prime example of effective visual communication in the realm of scientific research. These posters allow researchers to summarize their findings in a visually appealing and succinct format, making the information more accessible and understandable to a wider audience. The key to a successful scholarly or research poster often lies in the balance between visuals and text. Too much text can be overwhelming, while too few visuals can make the poster unappealing. The right mix, however, can create a compelling narrative that captures attention and engages the viewer. Scholarly posters also offer researchers a platform to showcase their research in a concise and impactful manner, which can be particularly beneficial at conferences, meetings, or other academic events. Now that we have rooted visual communication in scholarly posters, let’s delve into the art and science of creating these valuable tools in the following section.
The Science of Creating Scholarly Posters
Decoding the Art of Communicating Data through Scholarly Posters
Communicating data effectively through scholarly posters is both an art and a science. It involves a careful balance of aesthetics, clarity, and scientific rigor. The first step in this process is to understand your audience. Knowing who will be viewing your poster helps tailor your content to their knowledge level and interest. The next step is to structure your poster in a way that flows logically and guides the viewer through your research. This usually means starting with an introduction, moving through your methodology, presenting your results, and concluding with your findings’ implications.
Visuals are a central part of this process. Graphs, charts, and diagrams should be used to represent data and illustrate key points. These visuals should be carefully designed to be clear, accurate, and visually appealing. Color schemes should be chosen thoughtfully to enhance readability and draw attention to key points. Text should complement visuals, providing necessary context and details while being brief and easy to read.
Creating an effective scholarly poster is a skill that can be honed over time. In the next subsection, we will explore the importance of user-friendly design in scholarly posters.
Importance of a User-friendly Design In Scholarly Posters
User-friendly design is crucial in scholarly posters. In essence, it makes the information easy to find, understand, and remember for the audience. When a poster design is user-friendly, the viewers can quickly grasp the key points and follow the narrative of the research without getting overwhelmed. This involves a clear structure, logical flow of information, easily readable text, and effective use of visuals.
An appealing and user-friendly design can make all the difference in how your research is perceived. It can turn a complex scientific study into an engaging narrative, making your research more accessible to a wider audience. Moreover, a user-friendly design can also enhance the viewer’s experience, inspiring them to engage more deeply with your research.
The use of color, typography, and whitespace are all important elements of a user-friendly design. They should be used strategically to guide the viewer’s attention and emphasize key points. The goal should always be to simplify and clarify, making the information as easy to digest as possible.
In the next section, we will introduce you to Mind the Graph’s services, a platform designed to support and help you create user-friendly scholarly posters.
Mind The Graph: Your Simple Solution
An Introduction to Mind the Graph’s Services
Mind the Graph is an online platform designed to enhance scientific communication by making it more visually engaging. The platform offers a wide range of services aimed at helping scientists and researchers create visually appealing figures, infographics, graphical abstracts, presentations, and scholarly posters.
Mind the Graph provides a user-friendly interface that makes it easy for anyone, regardless of design experience, to create visually stunning posters. The platform offers a vast library of scientifically accurate illustrations across 80+ popular fields, making it a one-stop solution for scientific visuals.
Besides, Mind the Graph also allows you to customize your designs, providing a variety of templates and design elements that you can tailor to your specific needs. This flexibility ensures that your research is presented in a way that aligns with your unique style and vision.
Moreover, the tool also offers a collaborative platform where you can work with your team in real time, making it an ideal solution for small labs and large organizations.
In the next subsection, we’ll delve deeper into the ease of creating scientific figures with Mind the Graph, the best infographic maker for becoming a successful author.
The Ease of Creating Scientific Figures with Mind the Graph

One of the significant advantages of Mind the Graph is the ease with which users can create scientific figures. The platform is designed with a user-friendly interface that is intuitive to navigate, even for those without computer programs or any previous design experience.
The process starts with choosing a template from a wide range available. Users can then customize their chosen template using the platform’s drag-and-drop feature, adding or replacing elements as needed. The platform’s library boasts over 40,000 scientifically accurate illustrations that users can incorporate into their designs, simplifying the process of visualizing complex scientific data.
Furthermore, MindtheGraph.com also allows users to upload their images, offering greater layout flexibility and personalization. Once the design is complete, it can be downloaded in various formats, ready for presentation, display, or publishing.
In essence, Mind the Graph simplifies the process of creating scientific tables and figures, making it an accessible tool for all researchers. The platform allows scientists to focus on their research, leaving the visual communication to MindtheGraph.com. In the next section, we will look into the impact of scholarly posters in the scientific community.
The Impact of Scholarly Posters
The Power of Scholarly Posters in Enhancing Research

Scholarly posters possess a unique power to show ideas and enhance research. They are not simply visual aids but strategic tools for communicating complex scientific data in a manner that is both engaging and understandable.
Firstly, scholarly posters offer a concise overview of a relevant research project, allowing researchers to present their work in a compact, digestible format. This can be particularly beneficial in settings like conferences, where attendees can quickly grasp the essence of the research without needing to delve into lengthy papers or presentations.
Secondly, scholarly posters can amplify the reach of research. They act as a visual hook, drawing in viewers and fostering discussions around the presented research. This can lead to new collaborations, fresh insights on a particular topic, and increased exposure for the research.
Lastly, printed scholarly posters can also serve as a lasting reference for the research. Unlike a spoken presentation, a printout poster remains accessible after the event, offering a lasting impact that extends the lifespan of the research.
In essence, scholarly posters are powerful tools in the research process, enhancing both the presentation and impact of scientific findings. In the discussion in the next subsection, we will delve deeper into their essential role in the scientific community.
Why Scholarly Posters are Essential in the Scientific Community
Scholarly posters play an essential role in generating discussion in the scientific community. They provide a common platform for researchers across different fields and stages of their careers to share their work and engage in constructive discussions.
These posters help democratize knowledge, making complex research accessible to a broader audience. This includes not only other scientists but also students, educators, policymakers, and the public. By doing so, they foster a culture of openness, collaboration, and knowledge-sharing that is fundamental to scientific advancement.
Scholarly posters are also a crucial tool for early-career researchers. They provide an opportunity to showcase their work, receive feedback, and network with other researchers. This can lead to collaborations, mentorships, and other professional opportunities that can significantly advance their careers.
Moreover, scholarly posters are commonly used in conferences, symposiums, and other academic events. They enable researchers to share their work on a large scale, reaching a global audience and making a significant impact in their respective fields.
In the next section, we will explore how to utilize MindTheGraph for maximum benefit in creating effective scholarly posters.
How to Utilize Mind the Graph for Maximum Benefit
Tangible Benefits of Mind the Graph.com for Scientists and Researchers
Mind the Graph offers numerous tangible benefits for scientists and researchers. First and foremost, the platform simplifies the process of creating scientific figures, such as scholarly posters. With its user-friendly interface and extensive library of scientifically accurate illustrations, Mind the Graph makes it easy for anyone to create visually stunning and scientifically sound figures.
Another significant benefit is the collaborative feature of Mind the Graph. This functionality allows teams to work together in real time, making it an ideal solution for both small and large research groups. It enhances productivity and fosters a collaborative environment, which is integral to successful research work.
Furthermore, Mind the Graph also offers flexibility. Users can customize their designs to suit their unique style and requirements, ensuring that their research is presented in a way that aligns with their vision.
Lastly, by enhancing the visual communication of research, Mind the Graph can significantly increase the impact and reach of scientific studies. In the next subsection, we will provide tips on unlocking the full potential of Mind the Graph.
Unlocking the Full Potential of Mind the Graph
To unlock the full potential of Mind the Graph, it’s essential to leverage the platform’s diverse features. Start by exploring the vast library of scientifically accurate illustrations. It covers a wide range of fields, ensuring you can find visuals that accurately represent your research.
Make use of the customizable templates. These templates provide a solid starting point for your design, and customizing them allows you to create a unique visual representation of your research. Experiment with different layouts and elements until you find a combination that best communicates your data.
Collaborate with your team in real time using Mind the Graph’s collaborative features. This can streamline your workflow and ensure that everyone is on the same page. It also allows for real-time feedback, leading to a more refined and effective final design.
Finally, continuously refine your design. The beauty of Mind the Graph is that it allows you to tweak and improve your design at any stage of the process. Don’t be afraid to experiment and make changes as you go.
By fully utilizing these key features, you can maximize the benefits of Mind the Graph and create powerful scholarly posters that effectively communicate your research.
Examples and Case Studies
Real-world Success Stories of Researches Enhanced by Scholarly Posters
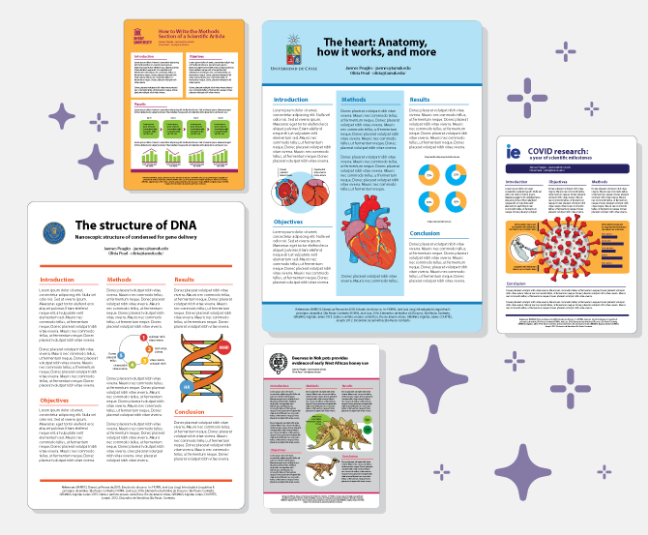
Scholarly posters have played a significant role in numerous real-world research success stories. For instance, a group of graduate students at a leading university used scholarly posters to present their research at a national conference. The visually compelling academic posters have caught the attention of industry leaders, leading to impactful discussions, valuable feedback, and potential collaboration opportunities.
In another case, a team of researchers at a biotech company used scholarly posters to share their groundbreaking findings with a wider audience. The visually engaging posters effectively communicated the complex data and implications of their research, making it accessible to both scientific and non-scientific audiences. The posters helped generate widespread interest and awareness about their work, significantly enhancing its impact and reach.
These real-world examples highlight and demonstrate the power of scholarly posters in enhancing research. They serve as effective tools for communicating complex scientific data, fostering discussions, and extending the reach and impact of research. In the next subsection, we will showcase the impact of Mind the Graph posters on scientific research.
Showcasing the Impact of Mind the Graph Posters on Scientific Research
Mind the Graph has made a significant impact on scientific research by enabling scientists to create visually appealing and scientifically accurate research posters themselves. For instance, a research lab at a renowned university used Mind the Graph to create posters for an international conference. The visually compelling posters, coupled with the concise and clear presentation of complex research data, garnered significant attention.
In another instance, a group of independent researchers leveraged Mind the Graph’s vast library of scientifically accurate illustrations to create a poster for a local science fair. The poster effectively communicated their research findings to a diverse audience, ranging from fellow scientists to students and the general public. The visually engaging poster helped them win the Best Poster Award at the fair, showcasing the power of effective visual communication in scientific research.
These examples underscore the impact of Mind the Graph in enhancing scientific research. By using data analysis providing an efficient and user-friendly platform, Mind the Graph empowers researchers to communicate their work visually, thereby increasing its reach and impact. Do as they did and start boosting your research with scientifically accurate visuals. Sign up for free!


Subscribe to our newsletter
Exclusive high quality content about effective visual
communication in science.