3 minutos de leitura
08/28/2018
Mind The Graph Scientific Blog foi criado para ajudar os cientistas a aprender a comunicar a ciência de uma forma descomplicada.
Uma vez feito todo o trabalho e revisto algumas centenas de vezes, chega o momento tão esperado: hora de enviar seu trabalho científico! É um longo caminho bem conhecido. Mas, as chances de seu trabalho ser aceito à primeira tentativa são baixas, então você se prepara para os seguintes passos: Vamos dar uma olhada mais de perto [...]
Se você acha que publicar um trabalho é a única maneira de obter visibilidade para seu [...]
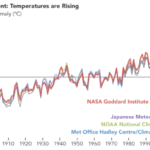
Quando o assunto é informação, combinar números e textos não é uma tendência. Chamando-o de infográfico [...]
Referência em visualização de dados, Alberto Cairo é um dos maiores nomes quando o assunto [...]
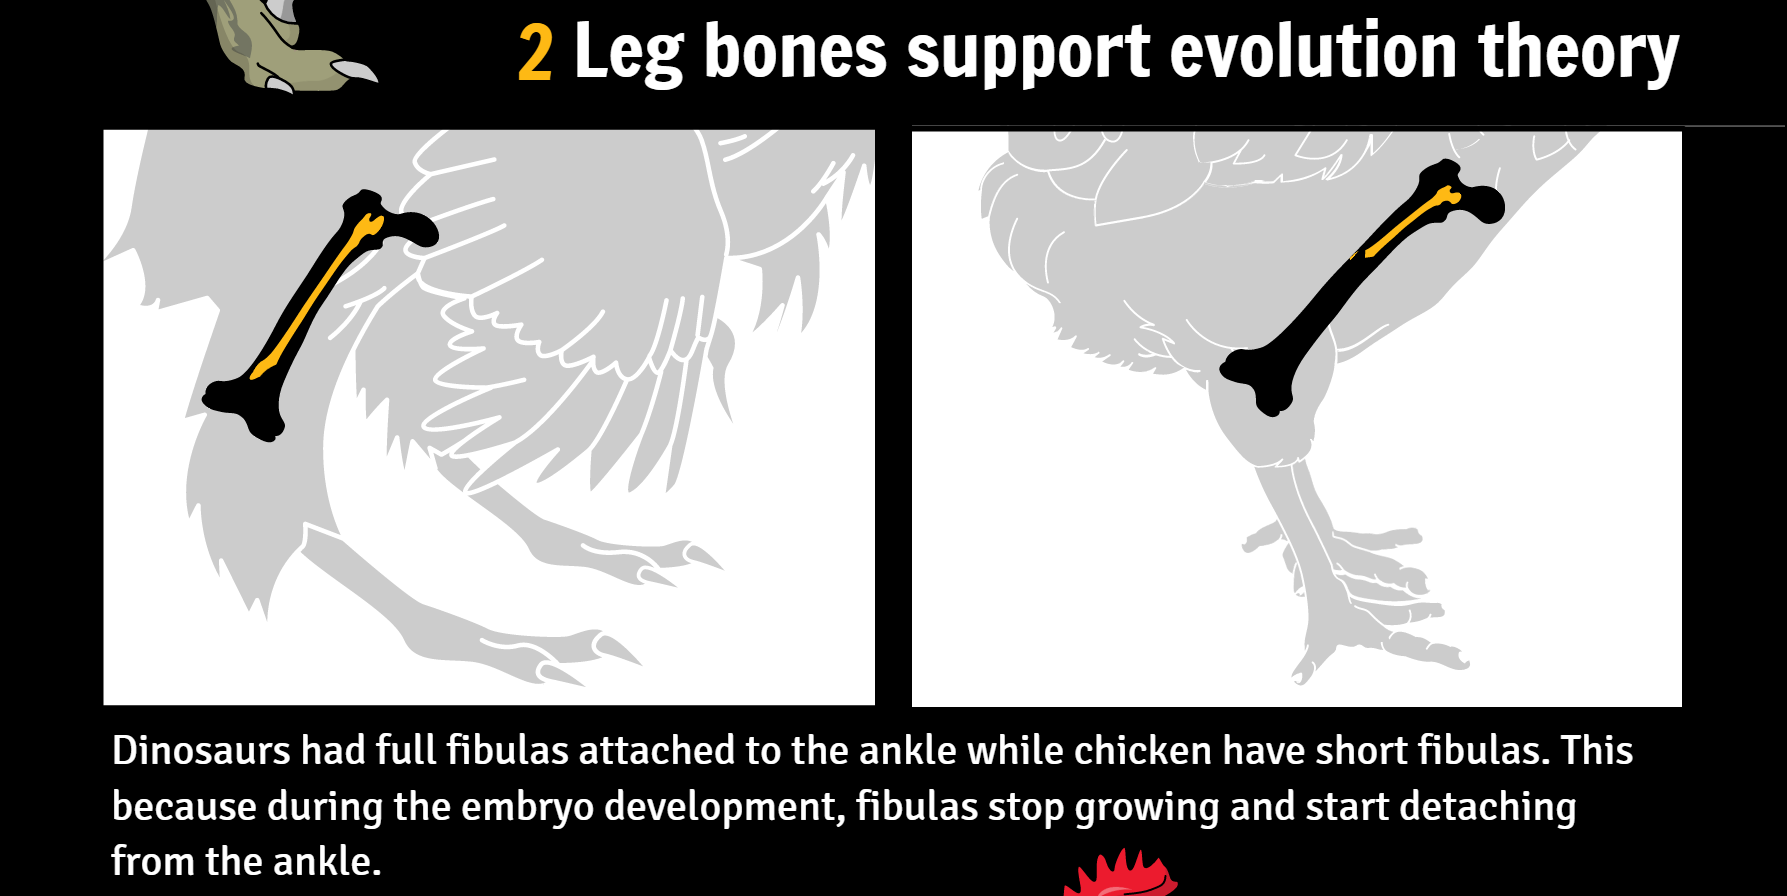
Na semana passada, Botelho et al. publicaram uma nova pesquisa sobre manipulação de genes em frangos. Seus [...]
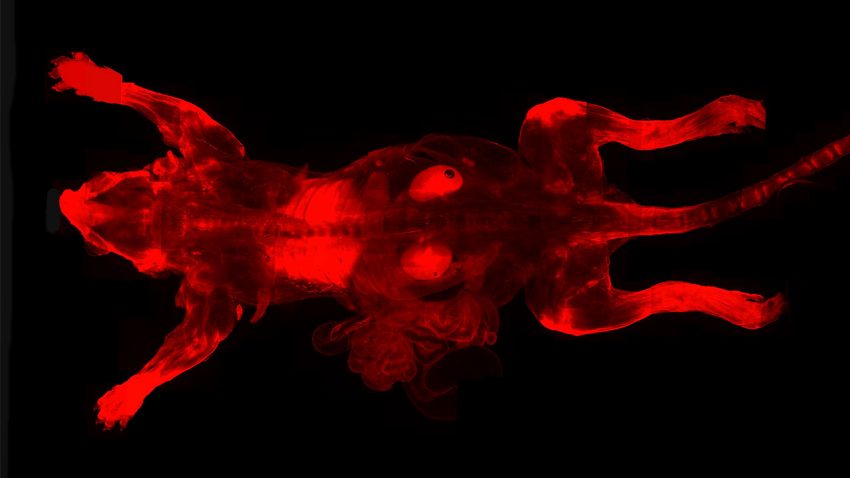
Os filmes de ficção científica nos deram esperança de desenvolver superpoderes como invisibilidade, super força [...]
Paris, França & San Diego, CA (27 de outubro de 2016) - AgileBio, um fornecedor líder mundial [...]
Isaac Newton Age 45 - Publicou a Philosophiae Naturalis Principia Mathematica (Princípios Matemáticos de [...]
É sempre uma celebração quando vemos o incrível trabalho de nossos usuários. Eu já escrevi sobre [...]
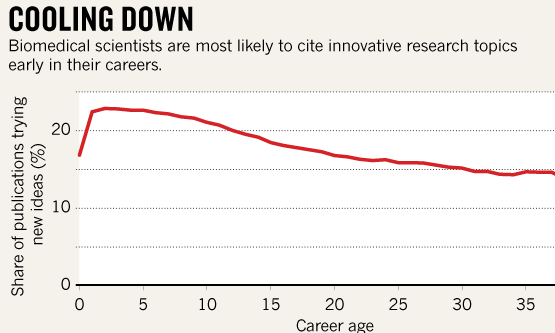
Ser um cientista não é tarefa fácil. A autonomia de ter seu próprio trabalho vem [...]
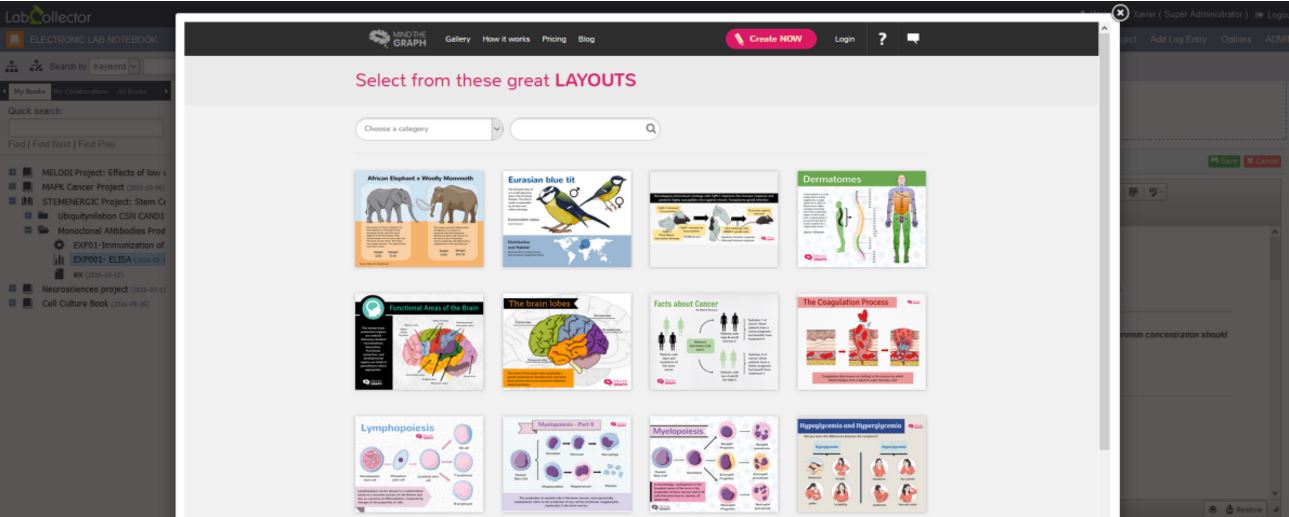
A primeira impressão que os usuários do Mind the Graph têm quando fazem login em nossa plataforma é: [...]
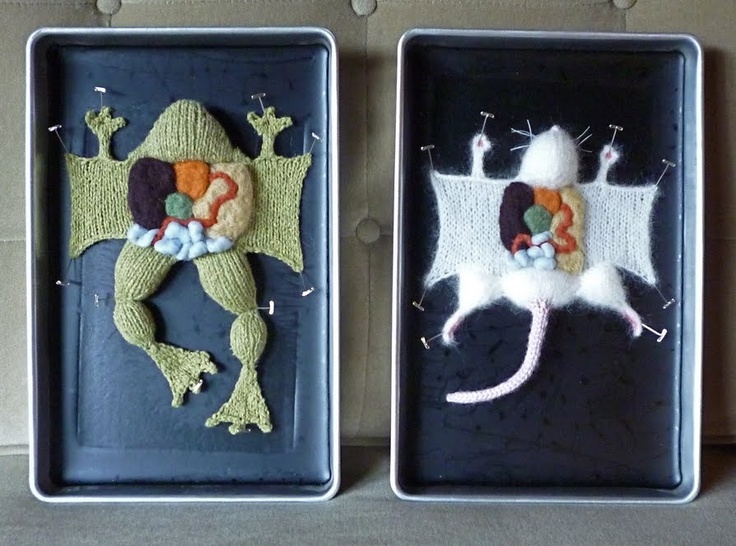
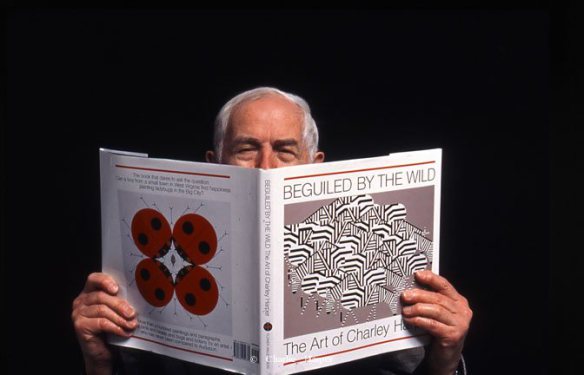
Quando se trata de arte científica, a maioria de nós pensa imediatamente em super realista e [...]
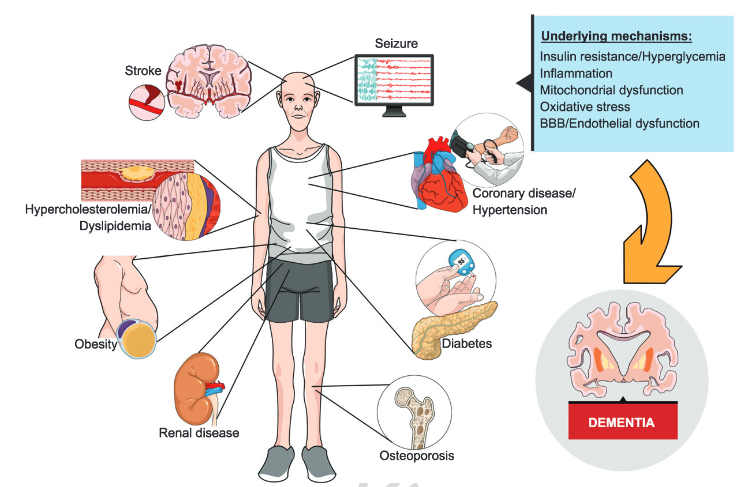
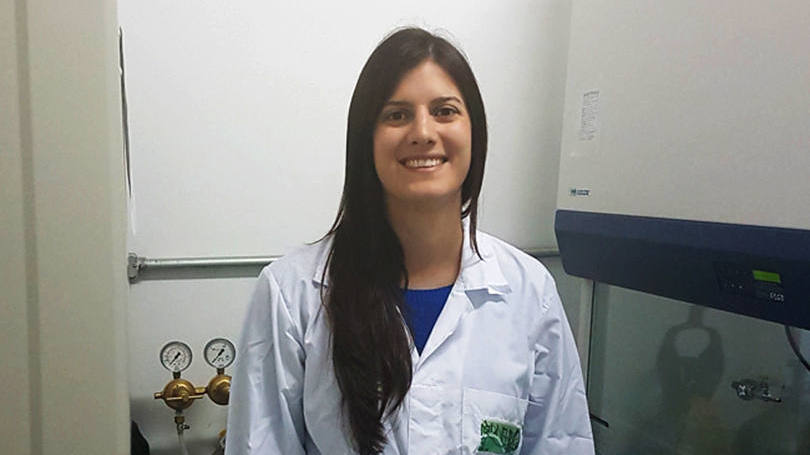
Pós- doutora em Ciências Biológicas, Gabriela Trevisan é especializada em dor e processos inflamatórios. Ela [...]