4 minutos de leitura
05/15/2019
Mind The Graph Scientific Blog foi criado para ajudar os cientistas a aprender a comunicar a ciência de uma forma descomplicada.
A ciência deve ser sobre curiosidade e perguntas, não sobre dogmas e respostas enlatadas. Portanto, os professores precisam mais do que ensinar contra a teoria da Terra plana. Precisamos ensinar o método científico de levantar hipóteses, fazer experimentações para explorar observações e responder perguntas. Um professor de física, Rhett Allain, escreveu sobre como ensinar a teoria heliocêntrica, ou em outras palavras, [...]
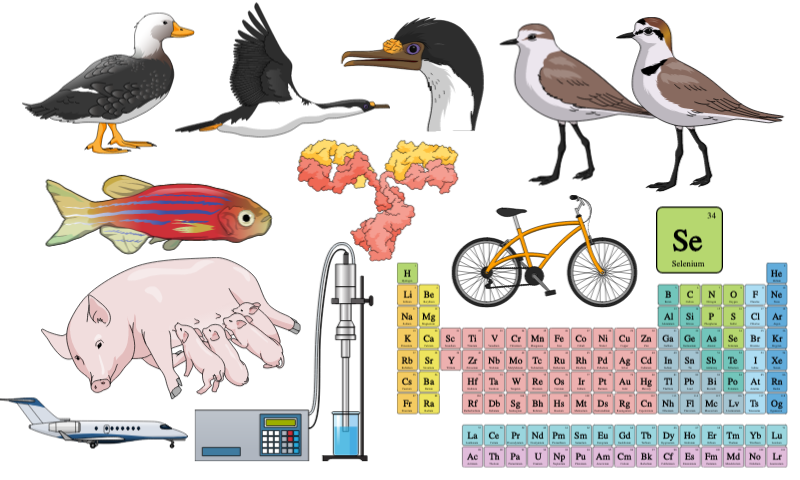
É hora de mostrar as novas ilustrações científicas do Mind the Graph. Como você sabe, [...]
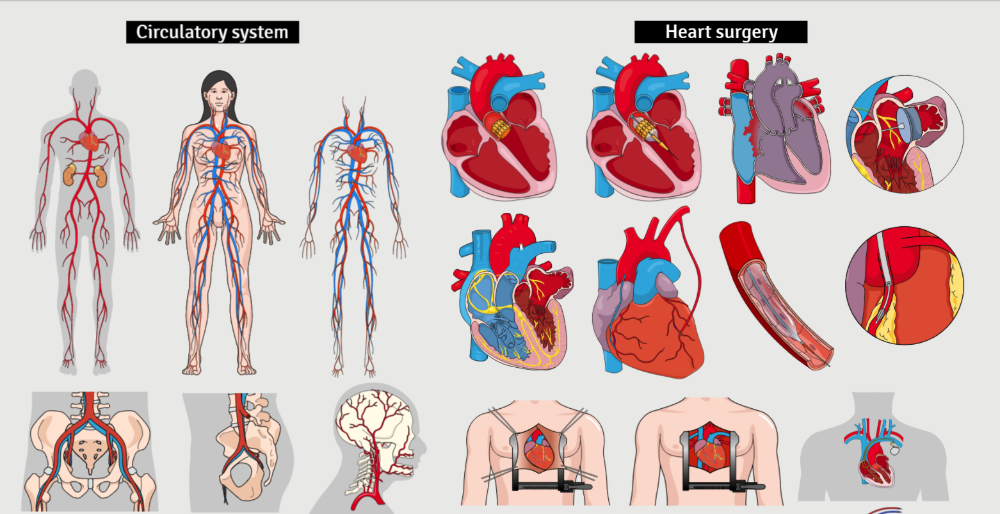
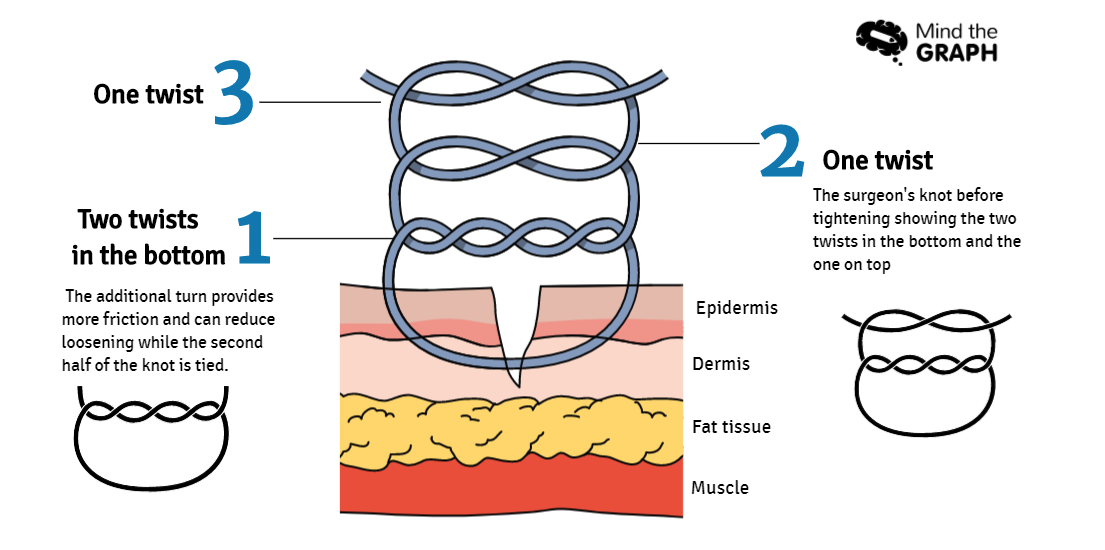
Não é fácil ser médico. Além de estar constantemente atualizado sobre novos procedimentos e tecnologia, [...]
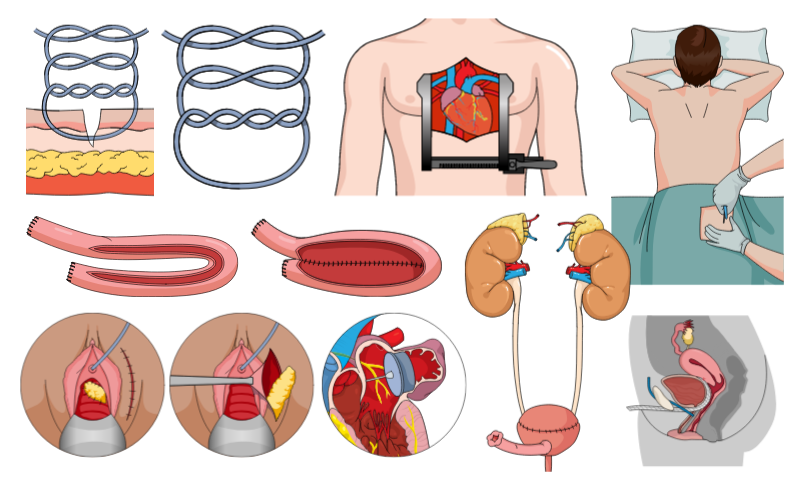
Imagens de doenças do sistema circulatório, como lesões cardíacas, são muito úteis para pacientes e pais [...]
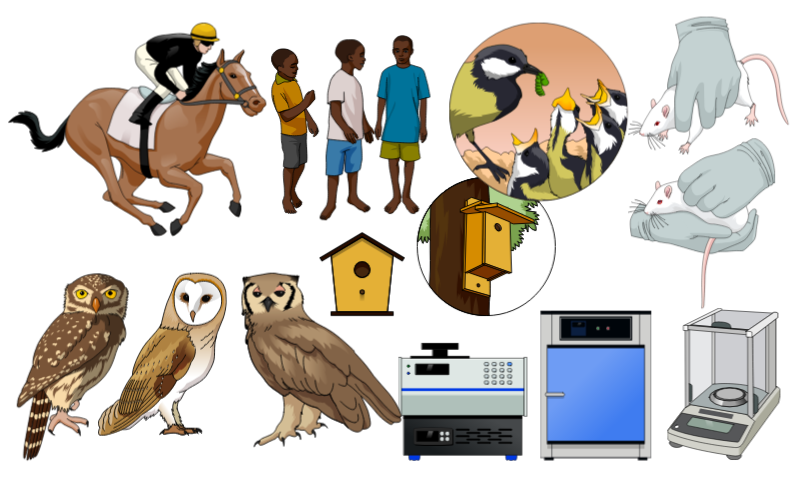
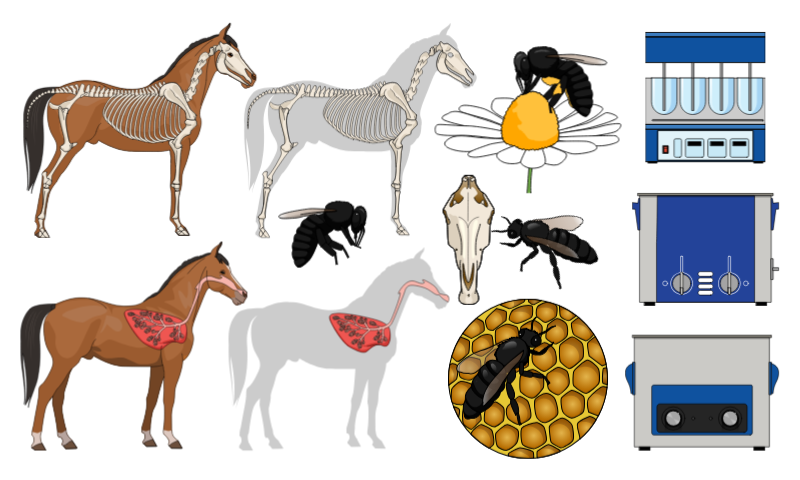
É comum usar duas ou três espécies diferentes em uma experiência. Além disso, [...]
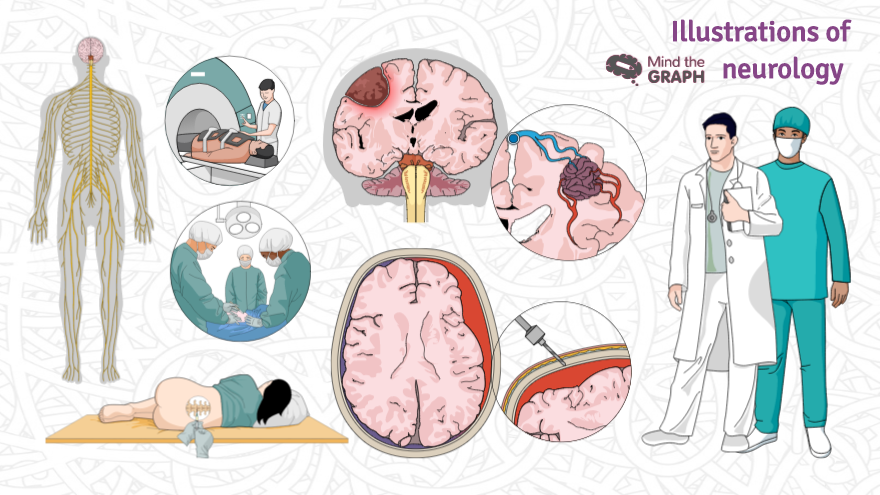
Os distúrbios neurológicos são doenças do cérebro, da coluna e dos nervos que os conectam. […]
Como você apresenta os procedimentos cirúrgicos em suas aulas e apresentações? Nem sempre é fácil [...]
É sexta-feira novamente (YAY), então é hora de ver as novas ilustrações científicas do [...]
Como médico, você provavelmente sabe a importância de se comunicar bem com seus pacientes. Eles [...]
Um resumo visual não é fácil de criar, mas está aqui para ficar. Portanto, nós sempre [...]
Olá, é sexta-feira novamente (YAY) e é hora de ver as novas ilustrações científicas de [...]
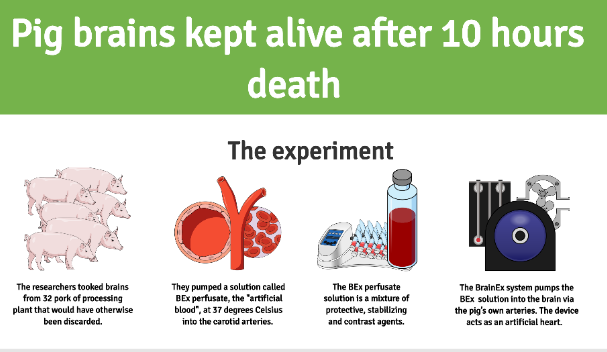
Os cientistas da Universidade de Yale mantiveram o cérebro de porco vivo fora do corpo durante horas após a morte. Os [...]
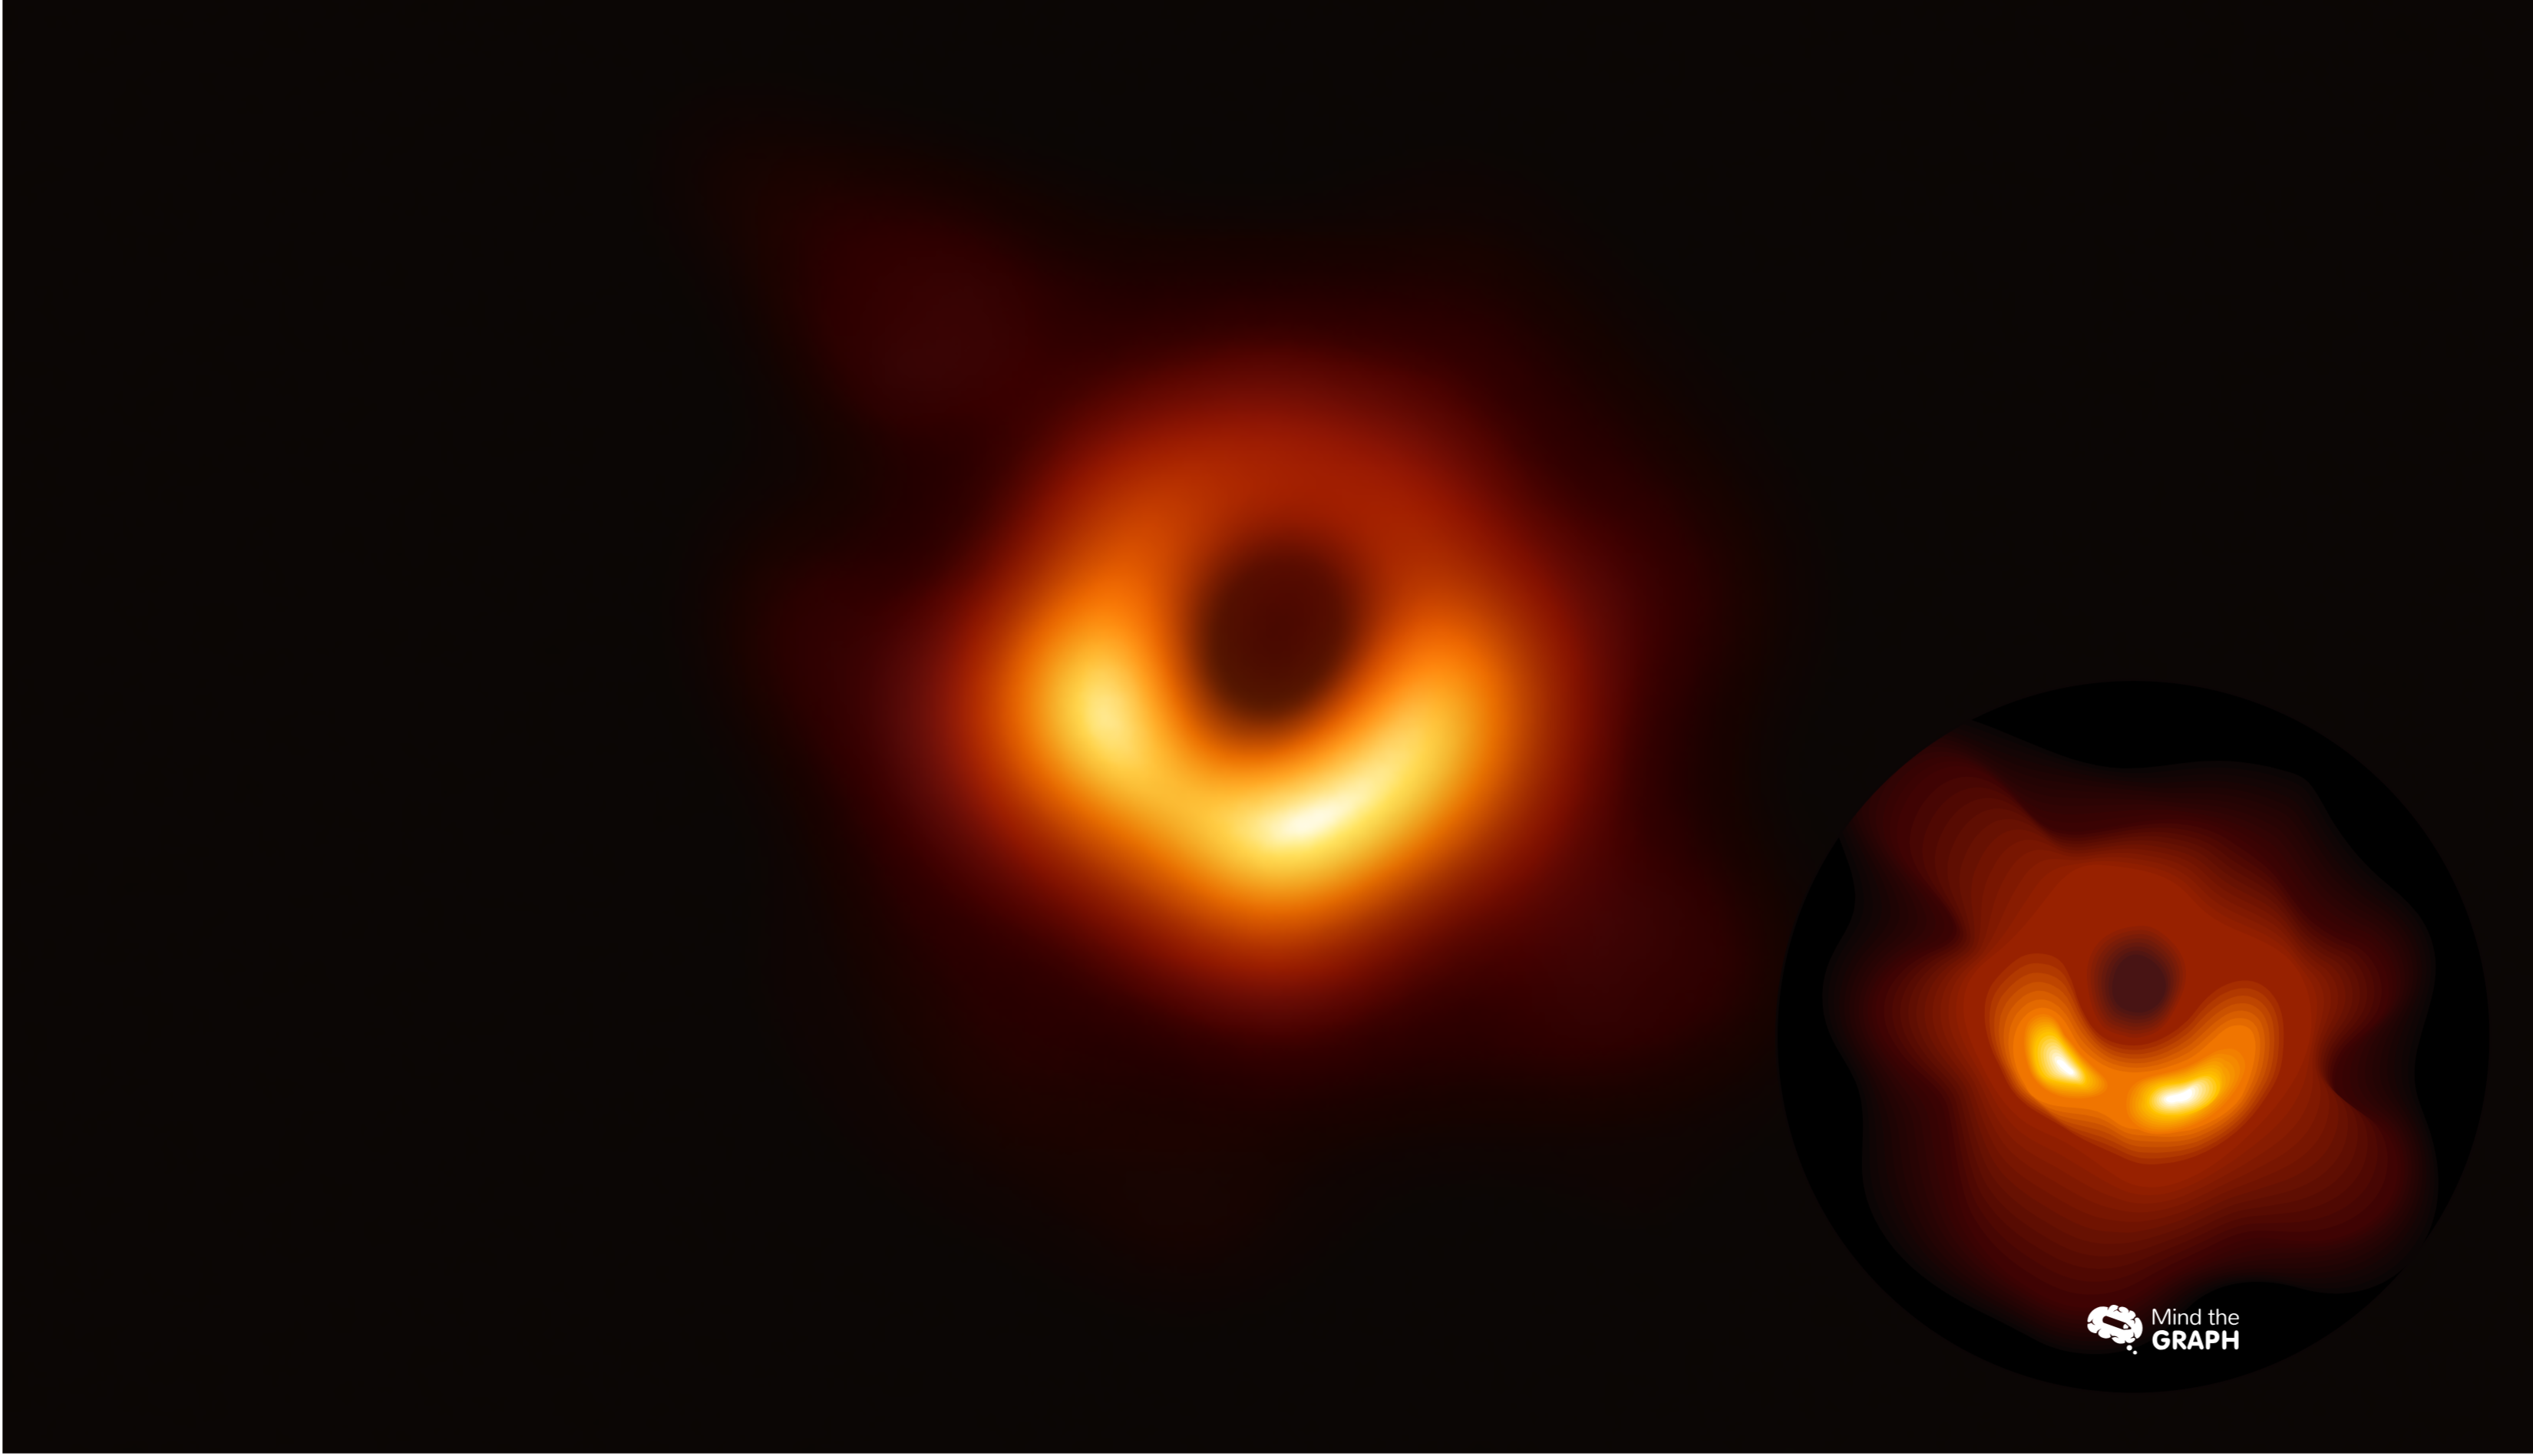
Os últimos dias têm sido emocionantes para todos os cientistas e entusiastas da ciência. Vimos por [...]