4 minutos de leitura
01/18/2023
Mind The Graph Scientific Blog foi criado para ajudar os cientistas a aprender a comunicar a ciência de uma forma descomplicada.
Os cientistas alcançaram recentemente avanços na fusão nuclear. Dê uma olhada nesta introdução fácil para aprender tudo sobre ela.
Encontre a melhor maneira de fazer uma playlist para produtividade que possa melhorar sua atividade cerebral e elevar seu desempenho.
Neste artigo, damos uma visão geral do nível de significância para que você possa compreender facilmente sua funcionalidade e importância.
Os vírus são fáceis de prevenir depois que você os conhece. Saiba mais sobre os 8 tipos diferentes que podem causar câncer e como evitá-los.
Cada campo tem problemas, e a ciência não é exceção. Entenda o que é a má conduta acadêmica e os muitos tipos.
O EBV é um dos vírus humanos mais prevalentes, uma vez que é tipicamente transmitido pela saliva. Saiba mais sobre ele e como evitá-lo.
O Alfa do Cronbach é a melhor abordagem para avaliar a confiabilidade da pesquisa. Saiba mais sobre ela e como interpretá-la.
Aprenda o que é combustível sustentável, como ele ajuda a reduzir a pegada de carbono no meio ambiente e sua importância.
A biologia celular e molecular tem melhorado substancialmente nos últimos tempos; descubra o que é o design da molécula e como ela está revolucionando a ciência.
Um estudo tem os dois lados da moeda, mas muitas vezes sentimos falta de seu lado negativo. Aprenda em detalhes o que é viés de publicação e como evitá-lo.
Saiba o que é uma bibliografia em um trabalho de pesquisa e como escrever uma bibliografia que torna seu trabalho de pesquisa indiscutivelmente perfeito.
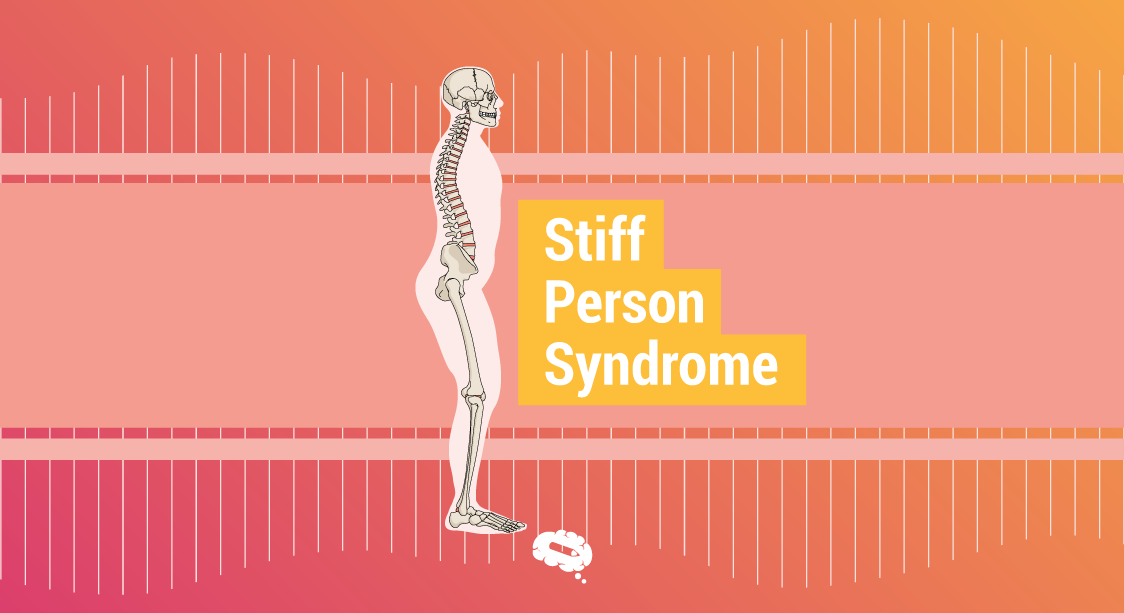
Este artigo lhe ensinará tudo o que você precisa saber sobre a Síndrome da Pessoa Rígida, uma condição auto-imune incomum.
Fazer um trabalho é difícil, então aprenda a diferença entre um trabalho de revisão e um trabalho de pesquisa, para determinar qual é o ideal para você.