
Interval variables are essential components of statistical analysis, providing valuable insights into quantitative data. In this comprehensive guide, we will explore the definition, measurement, and usage of interval variables, along with their benefits, examples, and applications.
By the end of this guide, readers will gain a clear understanding of interval variables and their significance in various fields, enabling effective data analysis and interpretation.
Related article: What’s the Difference: Qualitative vs Quantitative Research?
Definition Of Interval Variables
Interval variables, within the realm of statistics and data analysis, refer to a type of quantitative variable that represents measurements along a continuous scale. These variables possess both order and equal intervals between their values, allowing for meaningful comparisons and mathematical operations.
Unlike nominal or ordinal variables that categorize data or establish rankings, interval variables provide a more precise level of measurement. They enable researchers to assess the magnitude of differences between values, making them suitable for various statistical analyses.
Also read: Research Variables: Not the Usual Math Stuff
Examples Of Interval Variables
Examples of interval variables encompass a wide range of phenomena and measurements. Some common examples include:
- Temperature: Temperature is an interval variable that measures the degree of hotness or coldness. It is typically represented on scales such as Fahrenheit, Celsius, or Kelvin.
- Time: Time can be considered an interval variable, as it allows for meaningful comparisons and mathematical operations. For instance, the duration between two specific points in time can be measured and analyzed.
- IQ Scores: Intelligence quotient (IQ) scores are interval variables used to measure cognitive abilities. They represent a person’s relative intelligence compared to a standardized population.
- Standardized Test Scores: Scores from standardized tests like the SAT or GRE are interval variables. These scores measure a person’s performance on a specific exam and allow for comparisons between individuals.
Usage Of Interval Variables
Interval variables find extensive usage in various fields and research disciplines. They play a crucial role in statistical analysis, providing researchers with valuable insights and facilitating meaningful comparisons. Some common applications of interval variables include:
- Scientific Research: Interval variables are frequently employed in scientific research to measure and analyze physical quantities, experimental data, and numerical measurements. They enable researchers to assess the impact of variables and draw conclusions based on quantitative analysis.
- Social Sciences: In disciplines such as psychology, sociology, and economics, interval variables are used to measure constructs like attitudes, perceptions, and economic indicators. They help researchers quantify and analyze data to understand patterns and relationships.
- Quality Control and Process Improvement: Interval variables are utilized in manufacturing and quality control processes to measure and monitor variables such as temperature, pressure, or time. They assist in identifying trends, deviations, and optimizing processes for improved efficiency.
How To Measure Interval Variables
Measuring interval variables requires a systematic and precise approach to ensure accurate and reliable data. The following steps are typically involved in measuring interval variables:
- Define the Variable: Clearly define the variable of interest and determine its relevance to the research question or objective.
- Select an Appropriate Measurement Scale: Choose a measurement scale that is suitable for capturing the values of the interval variable. Common scales include numerical scales or standardized tests.
- Determine Units of Measurement: Establish the units of measurement for the interval variable, ensuring consistency across data collection and analysis.
- Collect Data: Gather data by directly measuring or observing the variable. This may involve instruments, surveys, questionnaires, or experimental procedures.
- Record Data: Record the collected data accurately, ensuring precision and attention to detail. Use appropriate data recording methods, such as digital tools or manual entry.
- Maintain Consistency: Consistently apply measurement techniques throughout the data collection process to ensure reliability and validity.
Benefits Of Using Interval Variables
Using interval variables in statistical analysis offers several benefits:
- Quantitative Analysis: Interval variables allow for quantitative analysis, enabling researchers to perform various statistical operations such as mean, median, standard deviation, and correlation. These operations provide a deeper understanding of the data and facilitate data-driven decision-making.
- Meaningful Comparisons: Interval variables enable meaningful comparisons between values. Researchers can assess the magnitude of differences between measurements, identify patterns, and draw valid conclusions based on the numerical values.
- Flexibility in Statistical Techniques: Interval variables are compatible with a wide range of statistical techniques, including parametric tests like t-tests and ANOVA. This flexibility allows researchers to employ sophisticated analytical methods for in-depth data exploration.
- Precise Data Interpretation: Interval variables provide a more precise level of measurement compared to nominal or ordinal variables. This precision allows for more accurate interpretations of the data and enhances the reliability of research findings.
Advantages And Disadvantages Of Using Interval Variables
The use of interval variables in statistical analysis comes with certain advantages and disadvantages. Understanding these can help researchers make informed decisions regarding their data collection and analysis approaches.
Advantages
- Greater Precision: Interval variables offer a higher level of precision compared to nominal or ordinal variables, allowing for more accurate and detailed measurement.
- Meaningful Comparisons: Interval variables enable researchers to make meaningful comparisons between values, facilitating statistical analysis and the identification of patterns and relationships.
- Compatibility with Statistical Techniques: Interval variables are compatible with a wide range of statistical techniques, empowering researchers to employ advanced analytical methods for in-depth data exploration.
Disadvantages
- Limited Information: While interval variables provide valuable insights into quantitative data, they do not capture all aspects of a phenomenon. Additional qualitative or contextual information may be necessary for a comprehensive understanding.
- Assumption of Equal Intervals: The interpretation of interval variables assumes equal intervals between values. However, this assumption may not always hold true, potentially impacting the accuracy and validity of analyses.
- Sensitivity to Scale Selection: Interval variables are sensitive to the choice of measurement scale, such as Fahrenheit, Celsius, or Kelvin for temperature. Different scales may yield different results and interpretations.
Despite these limitations, interval variables remain a fundamental tool in quantitative research, offering a valuable means of analyzing and interpreting numerical data.
Temperature Scale As An Example Of Interval Variable
Temperature serves as a prime example of an interval variable due to its characteristics and measurement attributes. It can be represented on different scales, including the Fahrenheit, Celsius, and Kelvin scales. These temperature scales exhibit the properties of an interval variable, allowing for meaningful comparisons and mathematical operations.
Fahrenheit Scale
The Fahrenheit scale is a widely recognized temperature scale commonly used in the United States. It assigns a numerical value to represent the temperature of a particular object or environment. The intervals between values on the Fahrenheit scale are equal, enabling precise measurements and calculations.
Celsius Scale
The Celsius scale is another commonly used temperature scale, particularly in scientific contexts and most countries worldwide. Like the Fahrenheit scale, the Celsius scale follows an interval measurement system, allowing for meaningful comparisons and mathematical operations.
Kelvin Scale
The Kelvin scale is an absolute temperature scale widely used in scientific research and calculations. It is based on the concept of absolute zero, where the value of 0 Kelvin represents the absence of molecular motion. Similar to the Fahrenheit and Celsius scales, the Kelvin scale adheres to the principles of an interval variable.

Difference Between Fahrenheit, Celsius, and Kelvin
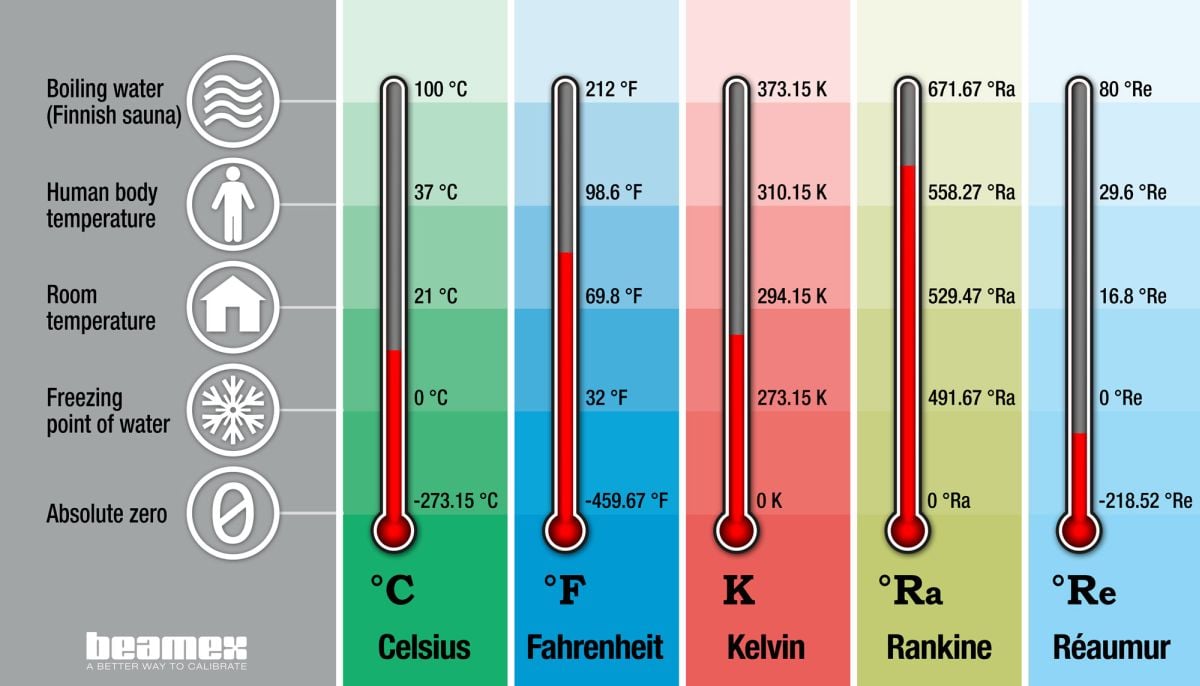
In summary, the Fahrenheit and Celsius scales are based on the properties of water, with different reference points for its freezing and boiling points. The Kelvin scale, on the other hand, is an absolute scale starting from absolute zero, which is the absence of molecular motion.
Other Temperature Scales
While Fahrenheit, Celsius, and Kelvin are the most well-known temperature scales, various other scales are used for specific applications, such as the Rankine and Réaumur scales. These scales also exhibit the characteristics of interval variables, providing researchers with options for temperature measurement and analysis.
Comparison Between The Different Temperature Scales
Each temperature scale offers its unique advantages and contexts of use. Comparing the different temperature scales allows researchers to convert temperature measurements between systems and analyze data across different contexts. Understanding the differences and relationships between these scales enhances the accuracy and versatility of temperature analysis.
SAT Scores As Another Example Of Interval Variable
Another prominent example of an interval variable is the scores obtained from standardized tests like the SAT (Scholastic Assessment Test). The SAT, a renowned examination employed for college admissions in the United States, holds significant recognition. The scores obtained from the SAT exam serve as interval variables, representing a student’s performance on the test.
The SAT Exam Structure
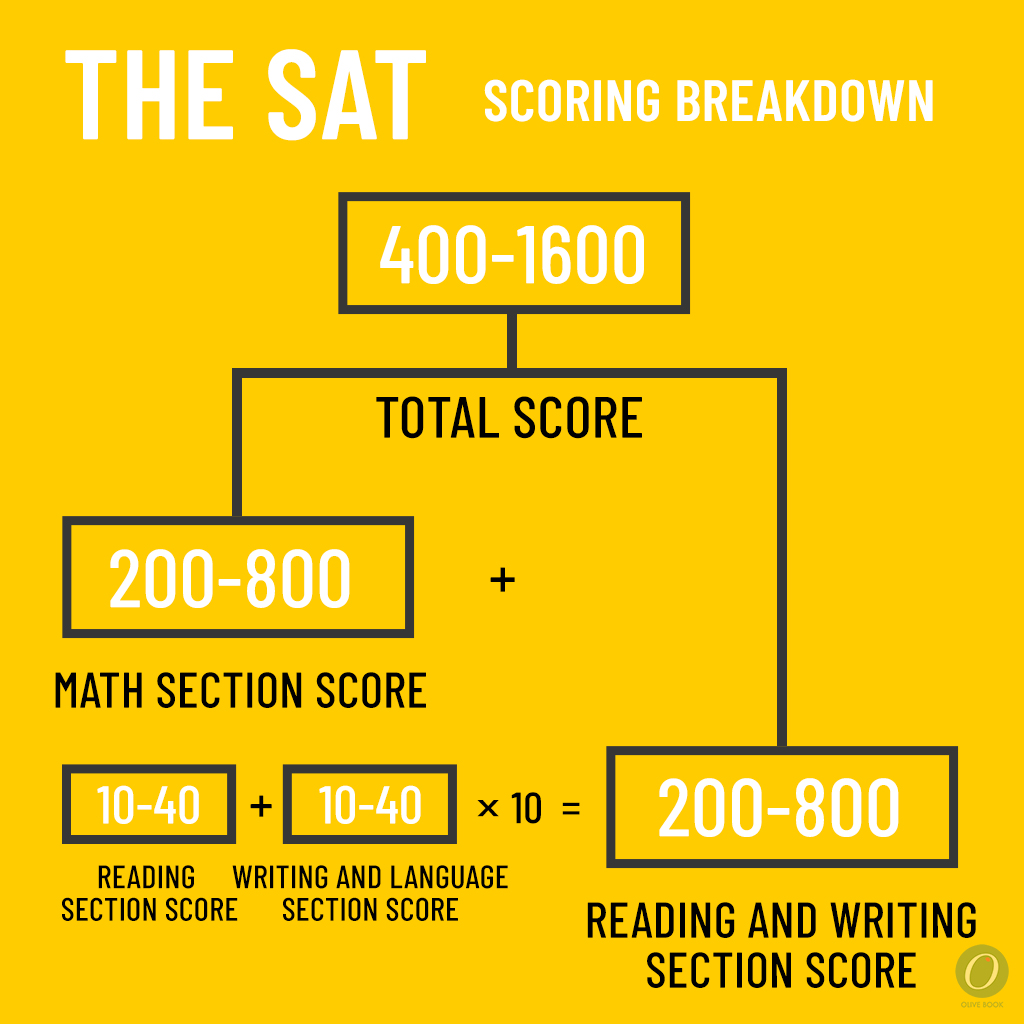
The SAT exam assesses a student’s skills in critical reading, writing, and mathematics. The format includes a series of multiple-choice questions along with an optional essay section. Each section is scored separately, and the scores are combined to obtain a total score.
Understanding The Score Results From The SAT Exam
The SAT scores are reported on a scale ranging from 400 to 1600, with separate scores for the Reading and Writing section (combined as the Evidence-Based Reading and Writing score) and the Mathematics section. These scores provide a numerical representation of a student’s performance, allowing for comparisons and analysis.
By considering the structure and interpretation of SAT scores, researchers can gain insights into educational performance, assess the effectiveness of educational programs, and investigate relationships between SAT scores and various factors.
In conclusion, interval variables, such as SAT scores, play a significant role in quantitative analysis. It offers precise measurements, meaningful comparisons, and compatibility with various statistical techniques.
Browse Through 75 000+ Scientifically Accurate Illustrations In 80+ Popular Fields
Unleash the power of Mind the Graph: 75,000+ accurate scientific illustrations in 80+ fields. Simplify complex concepts, captivate your audience, and accelerate scientific progress. Join a collaborative community and revolutionize scientific communication.


Subscribe to our newsletter
Exclusive high quality content about effective visual
communication in science.