3 perc olvasás
08/28/2018
A Mind The Graph tudományos blog célja, hogy segítsen a tudósoknak megtanulni, hogyan lehet a tudományt egyszerű módon kommunikálni.
Miután minden munka elkészült és pár százszor átnézve, elérkezik a várva várt pillanat: ideje benyújtani a tudományos dolgozatot! Ez egy hosszú, jól ismert út. De kicsi az esélye annak, hogy a dolgozatodat elsőre elfogadják, ezért készülj fel a következő lépésekre: Nézzük meg közelebbről [...]
Ha úgy gondolja, hogy a publikálás az egyetlen módja annak, hogy láthatóságot szerezzen a [...]
Ha a téma az információ, a számok és a szövegek kombinálása nem trend. Az infografika [...]
Referencia az adatvizualizációban, Alberto Cairo az egyik legnagyobb név, amikor a téma [...]
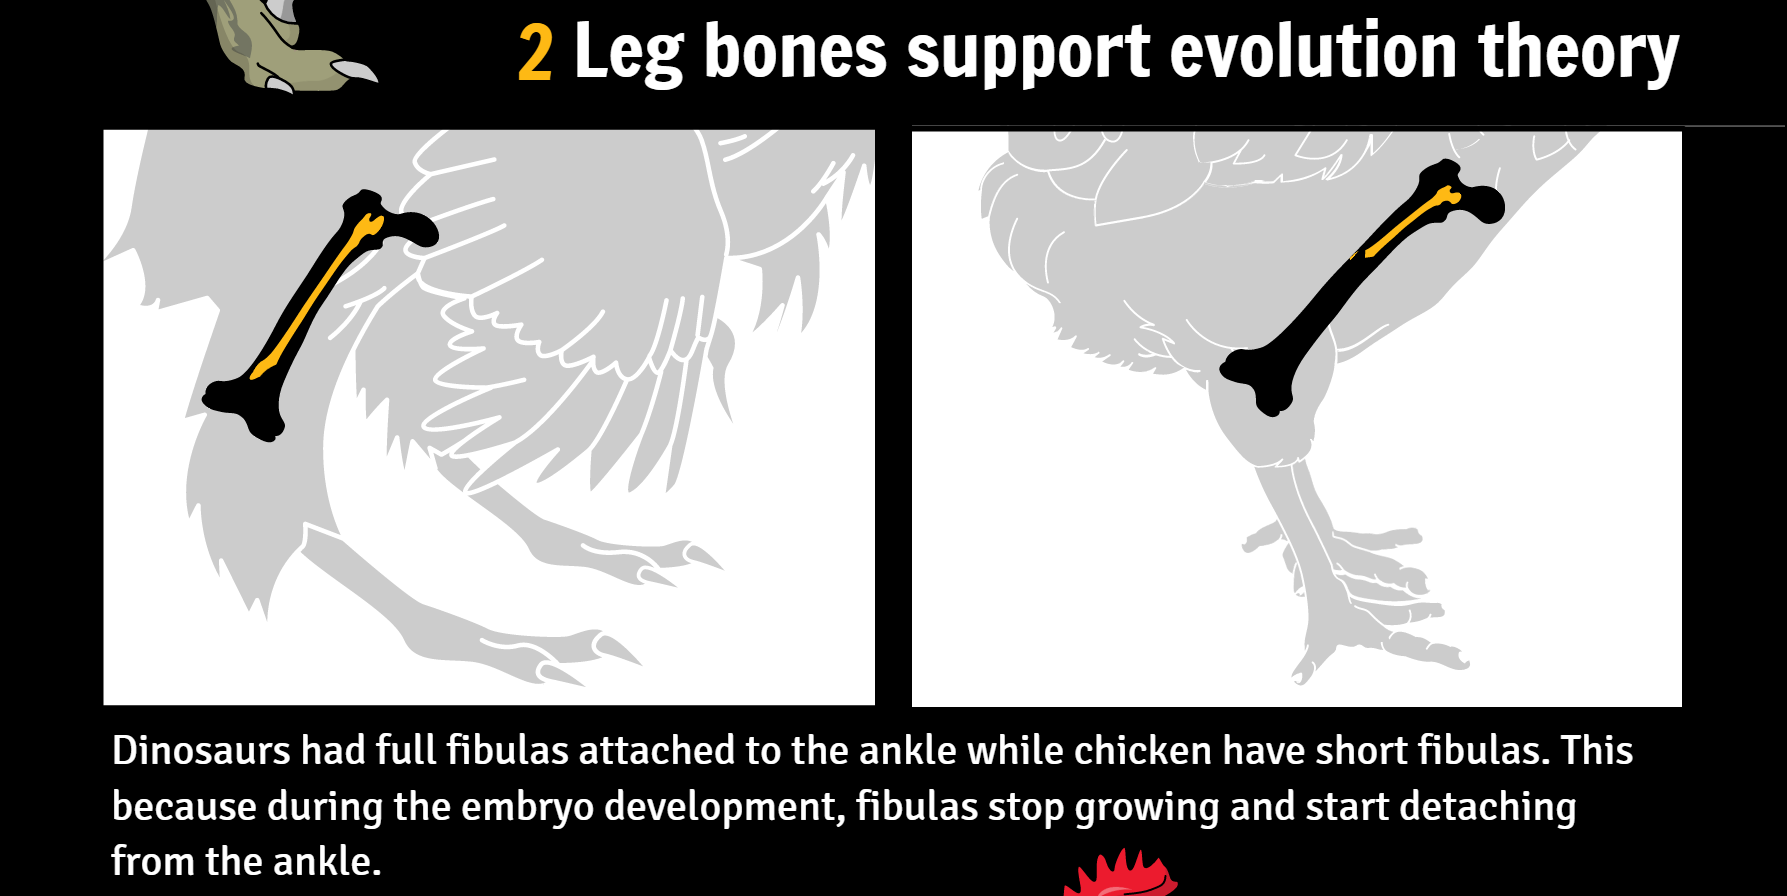
A múlt héten Botelho és munkatársai új kutatást tettek közzé a csirkék génmanipulációjáról. A [...]
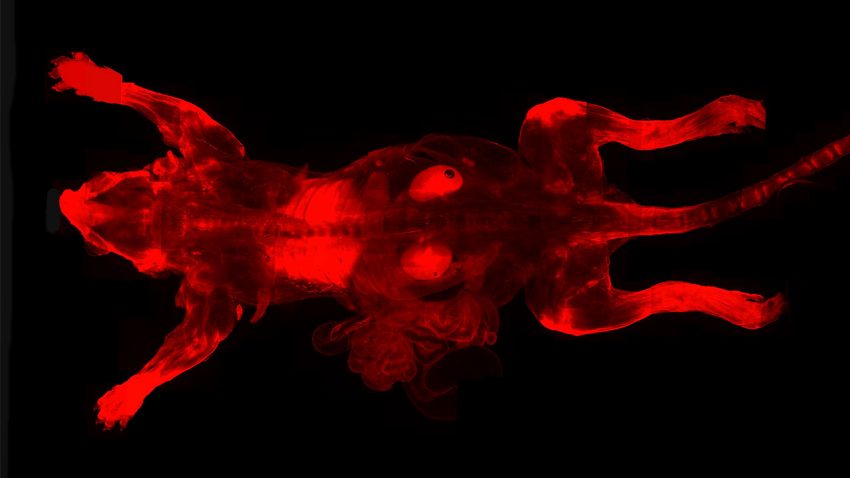
A sci-fi filmek reményt adtak nekünk a szuperképességek kifejlesztéséről, mint például a láthatatlanság, a szupererő [...]
Párizs, Franciaország & San Diego, CA (2016. október 27.) - Az AgileBio, a világ egyik vezető [...]
Isaac Newton 45 éves - Megjelent a Philosophiae Naturalis Principia Mathematica (A matematika alapelvei) [...]
Mindig nagy öröm, amikor látjuk felhasználóink csodálatos munkáját. Már írtam arról, hogy [...]
Tudósnak lenni nem könnyű feladat. A saját munkával járó autonómia [...]
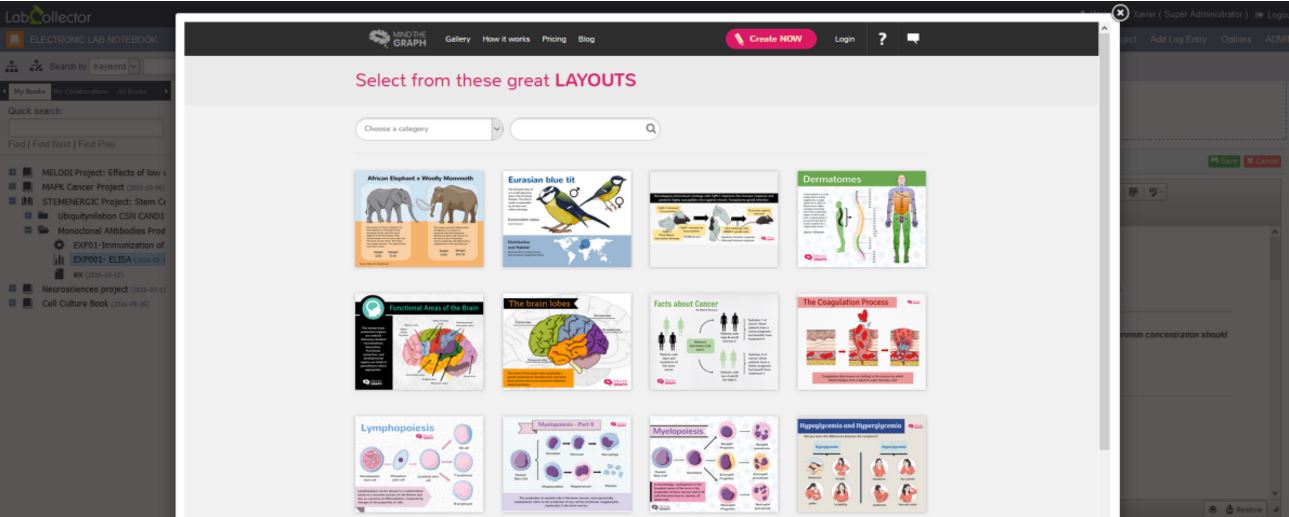
Az Mind the Graph felhasználók első benyomása, amint bejelentkeznek a platformunkra: [...]
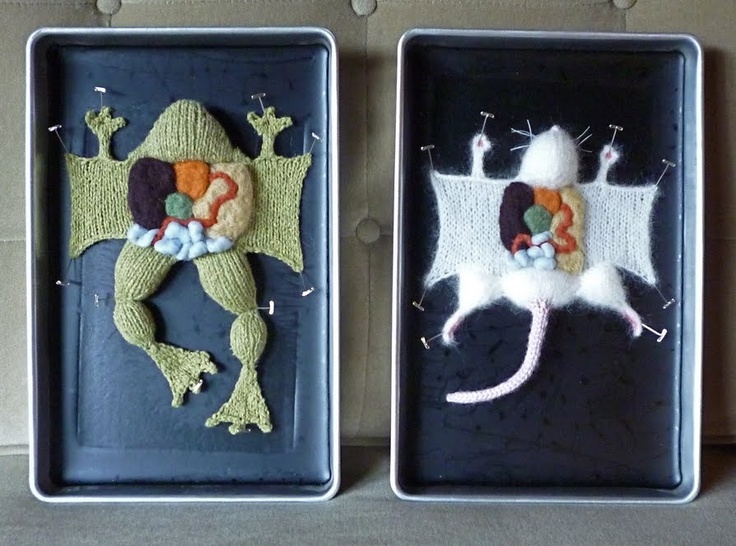
Amikor a tudományos művészetről van szó, a legtöbben azonnal a szuperrealista és [...]
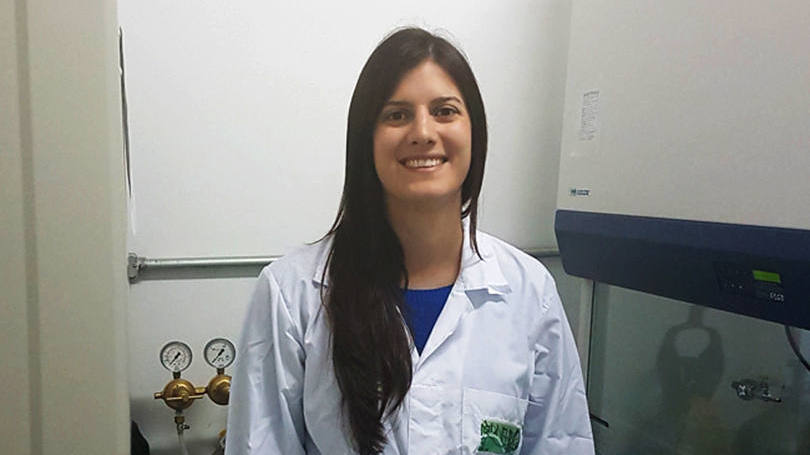
A biológiai tudományok doktora, Gabriela Trevisan a fájdalomra és a gyulladásos folyamatokra specializálódott. Az ő [...]