4 minutos de lectura
01/18/2023
El blog científico Mind The Graph pretende ayudar a los científicos a aprender a comunicar la ciencia de forma sencilla.
Los científicos han logrado recientemente avances en la fusión nuclear. Echa un vistazo a esta sencilla introducción para aprenderlo todo sobre ella.
Encuentre la mejor forma de hacer una lista de reproducción para la productividad que pueda mejorar su actividad cerebral y elevar su rendimiento.
En este artículo, le ofrecemos una visión general del nivel de significación para que pueda comprender fácilmente su funcionalidad e importancia.
Los virus son fáciles de prevenir después de conocerlos. Conoce los 8 tipos diferentes que pueden causar cáncer y cómo evitarlos.
Todos los campos tienen problemas, y la ciencia no es una excepción. Entiende qué es la mala conducta académica y sus muchos tipos.
El VEB es uno de los virus humanos más prevalentes, ya que suele transmitirse por la saliva. Obtenga más información sobre él y cómo evitarlo.
El alfa de Cronbach es el mejor método para evaluar la fiabilidad de una encuesta. Aprende más sobre él y cómo interpretarlo.
Conozca qué es un combustible sostenible, cómo ayuda a reducir la huella de carbono en el medio ambiente y su importancia.
La biología celular y molecular ha mejorado sustancialmente en los últimos tiempos; descubra qué es el diseño de moléculas y cómo está revolucionando la ciencia.
Un estudio tiene las dos caras de la moneda, pero a menudo pasamos por alto su lado negativo. Conozca en detalle qué es el sesgo de publicación y cómo evitarlo.
Aprenda qué es una bibliografía en un trabajo de investigación y cómo escribir una bibliografía que haga que su trabajo de investigación sea indiscutiblemente perfecto.
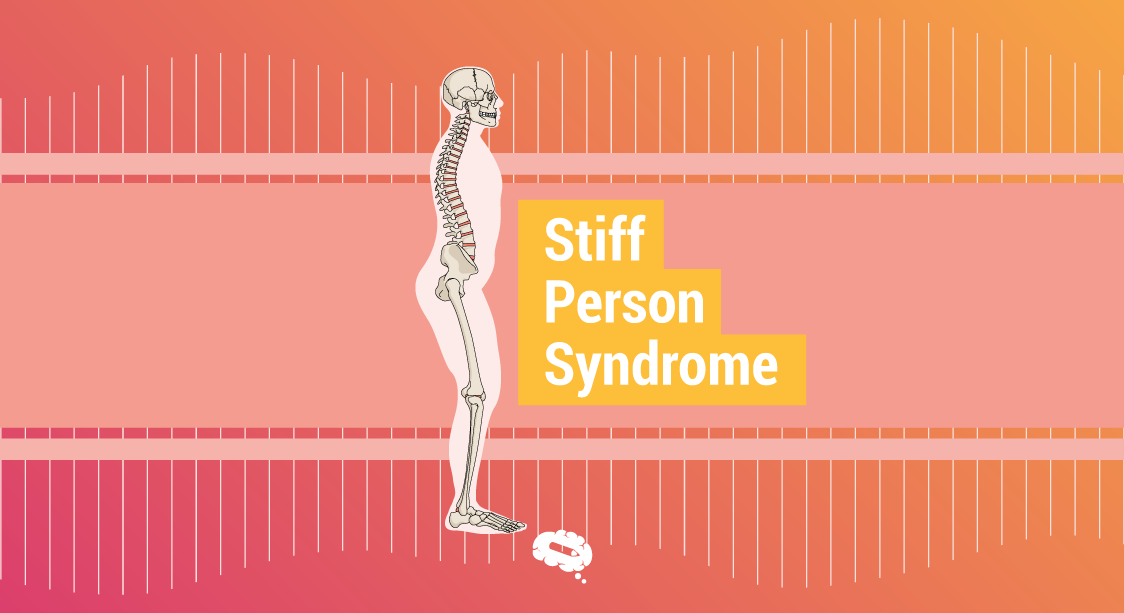
Este artículo le enseñará todo lo que necesita saber sobre el síndrome de la persona rígida, una enfermedad autoinmune poco común.
Hacer un trabajo es difícil, así que aprende la diferencia entre un trabajo de revisión y un trabajo de investigación, para determinar cuál es el ideal para ti.