1 minuto de lectura
07/26/2019
El blog científico Mind The Graph pretende ayudar a los científicos a aprender a comunicar la ciencia de forma sencilla.
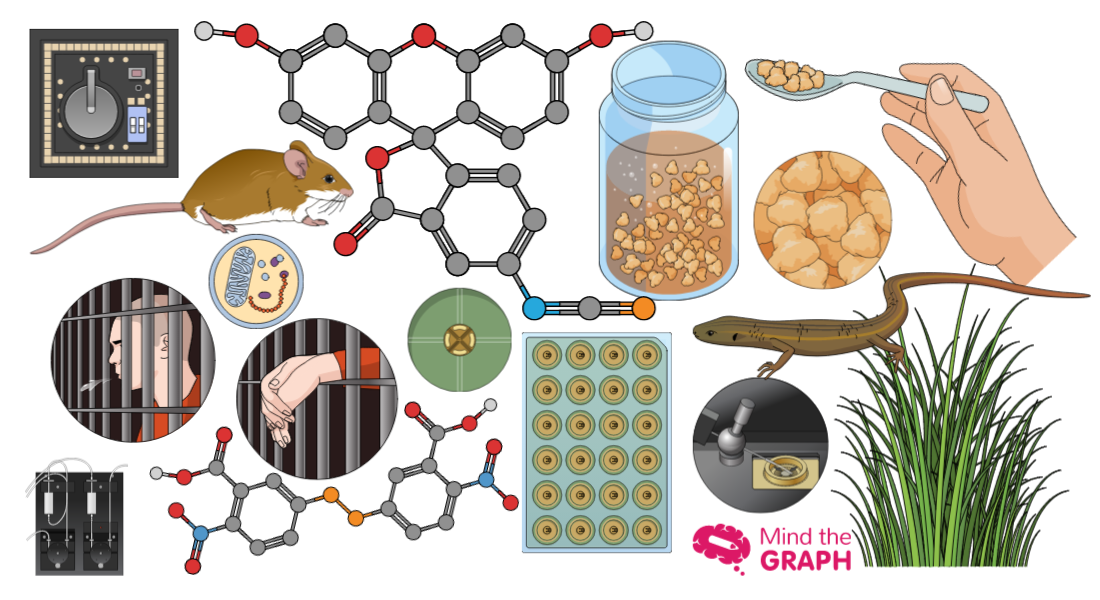
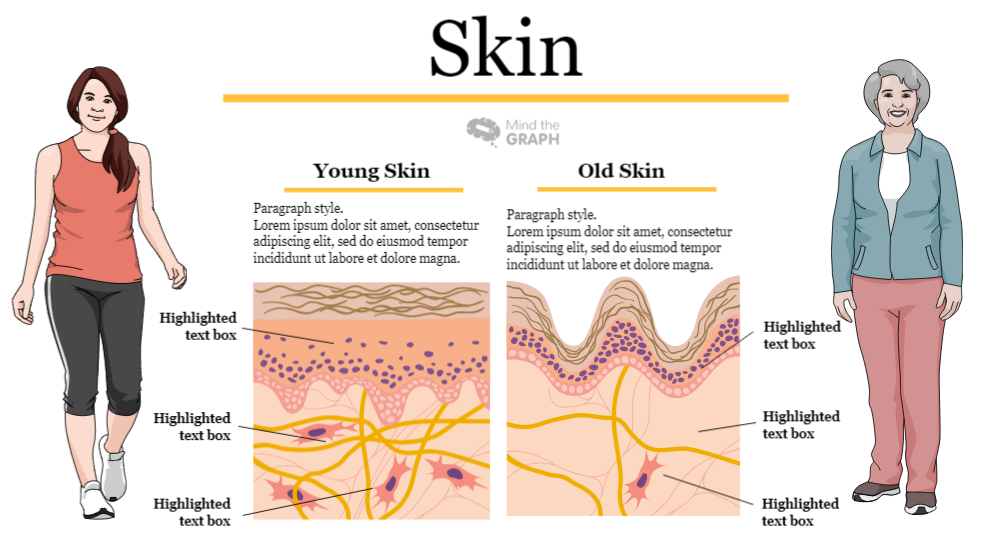
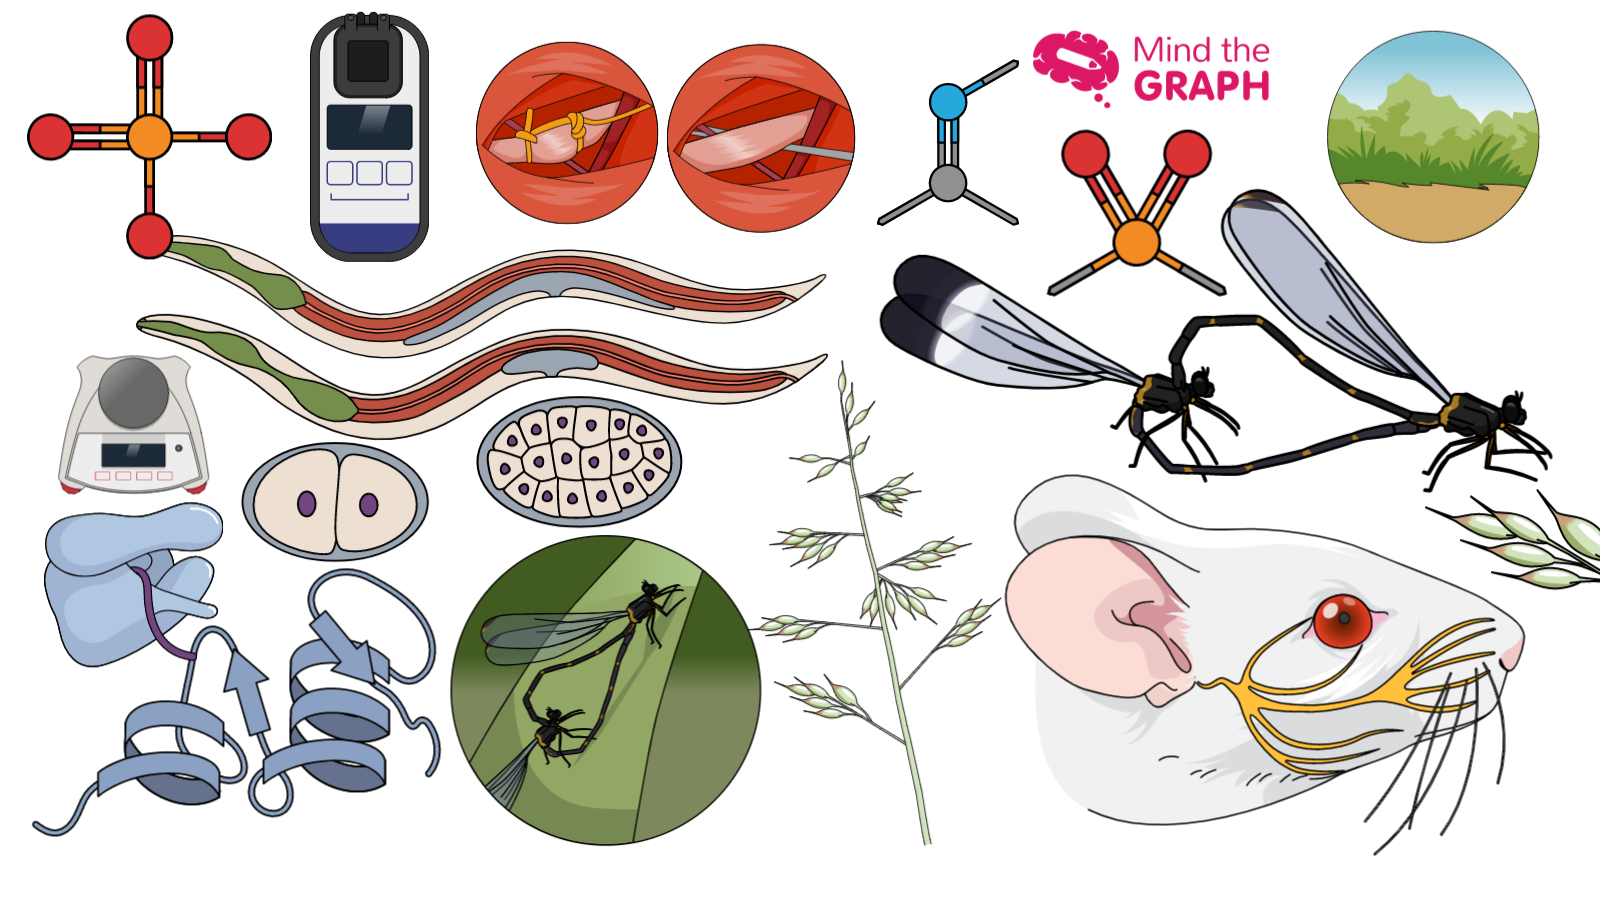
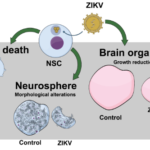
El viernes es el día en que mostramos nuestras nuevas ilustraciones científicas y médicas. Ya tenemos más de ocho mil ilustraciones en nuestra biblioteca que están disponibles para todos los usuarios de mind the graph (usuarios gratuitos incluidos). Con estas ilustraciones puedes crear resúmenes gráficos, infografías, trabajos, pósters, clases y todo lo que quieras. Por lo tanto, si eres un mind the [...]
La ciencia puede cambiar el mundo. Esto significa que nosotros, como científicos, tenemos un enorme poder. [...]
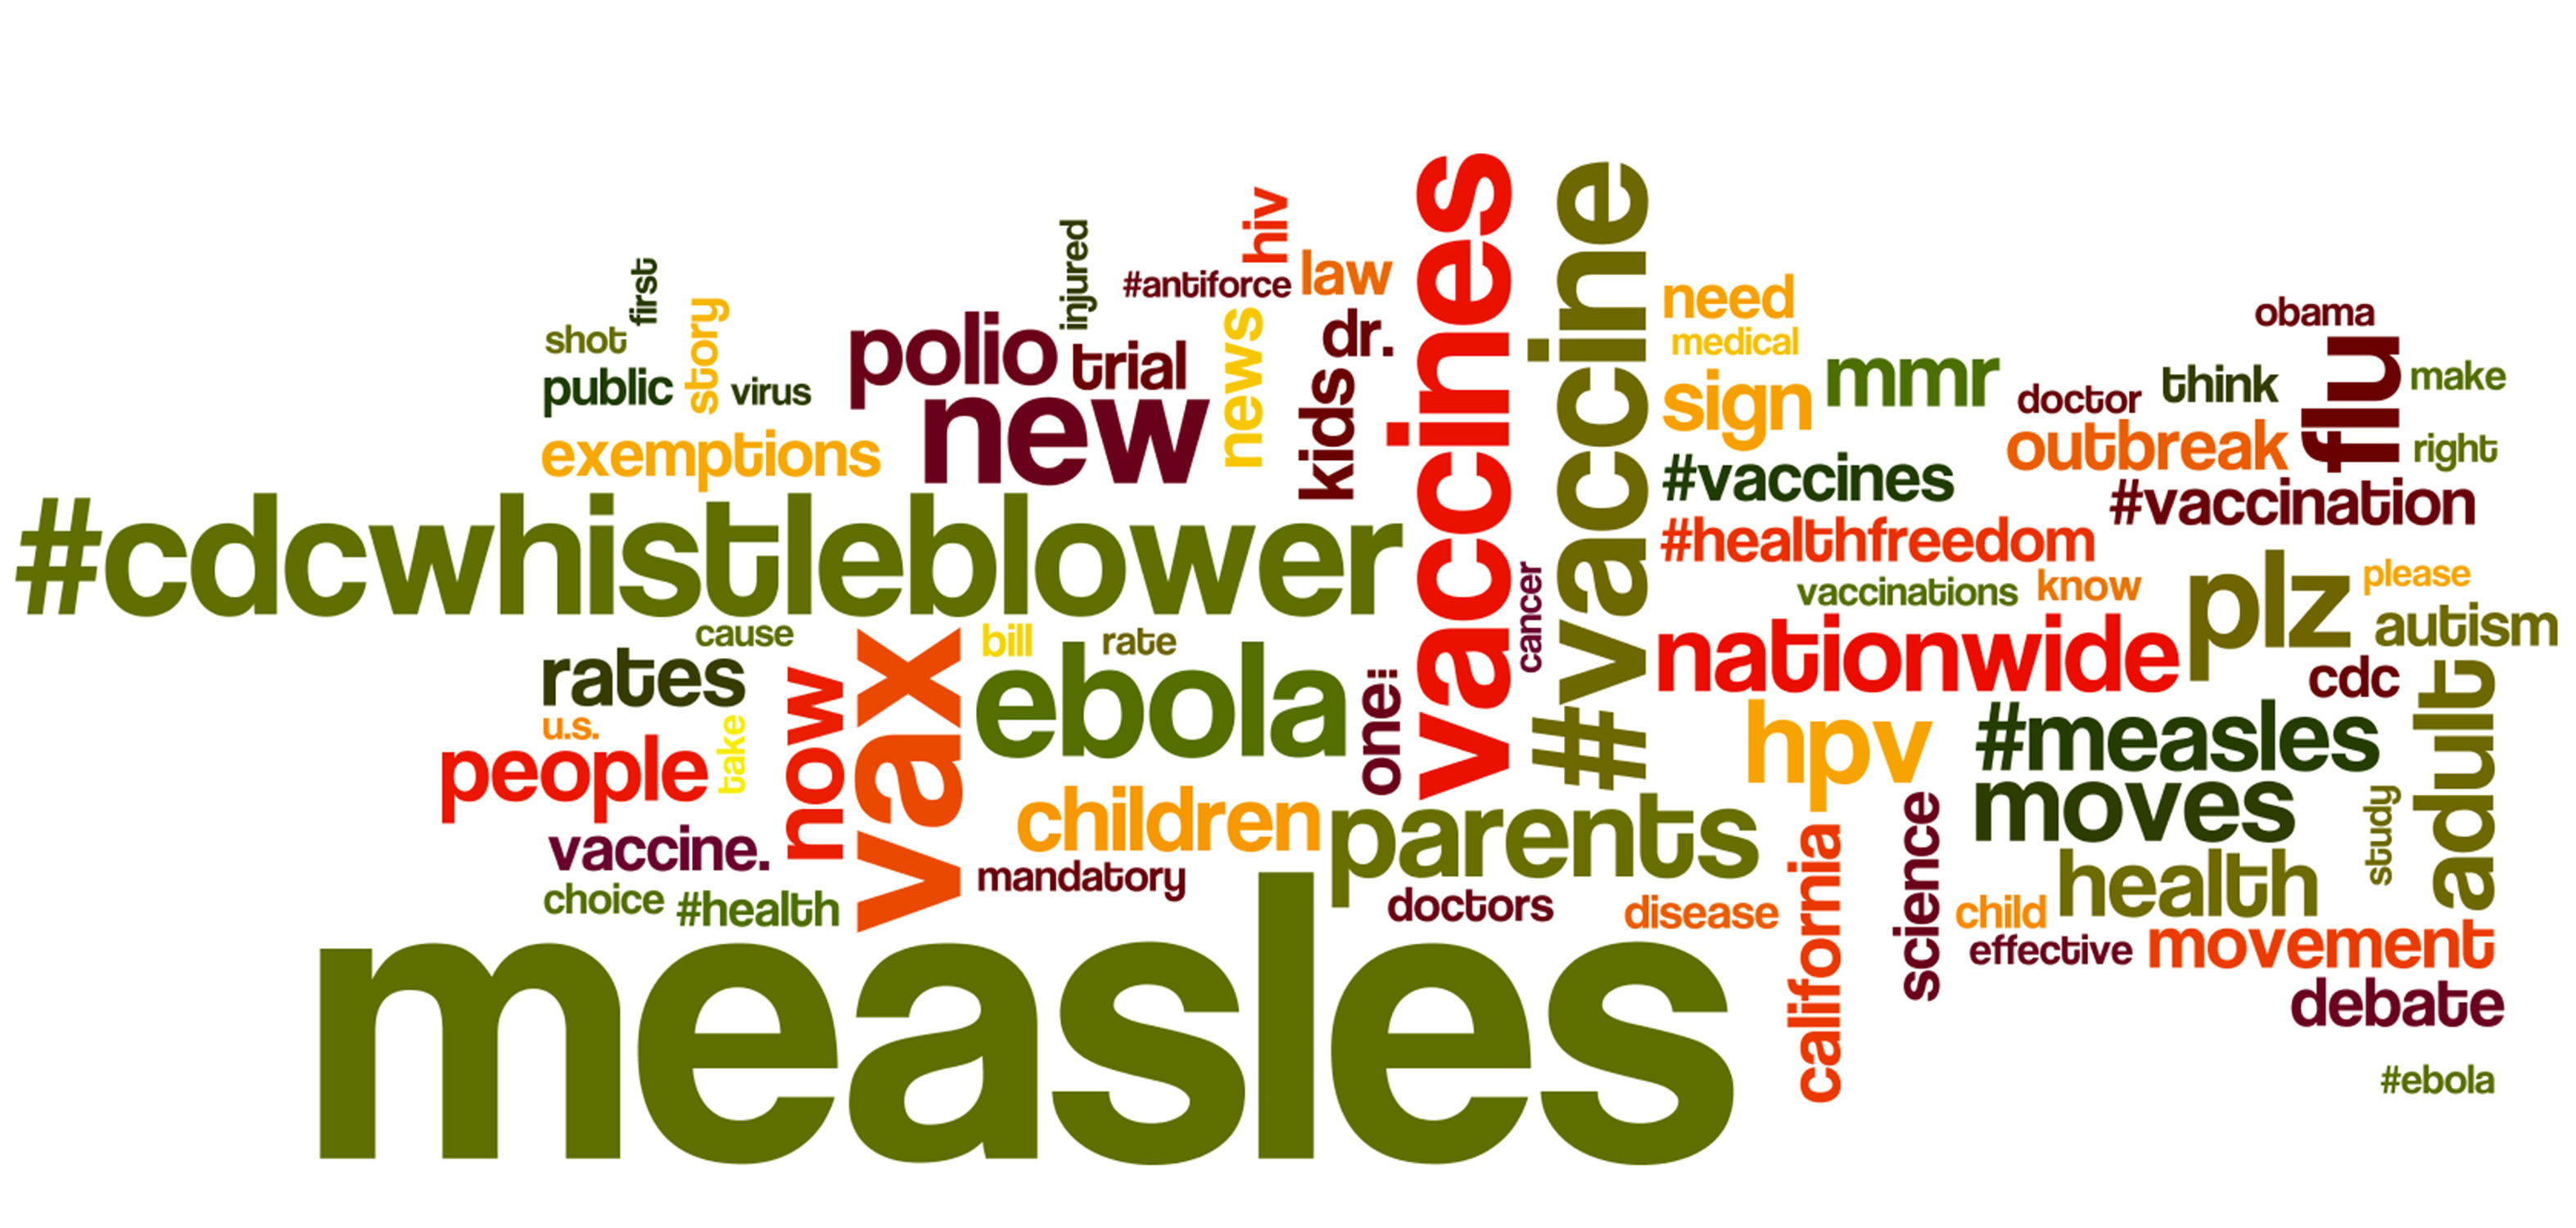
Captar y mantener la atención de los niños y adolescentes no es una tarea fácil. Pero [...]
Si eres científico, médico, estudiante o investigador, sabes que hacer presentaciones es [...]
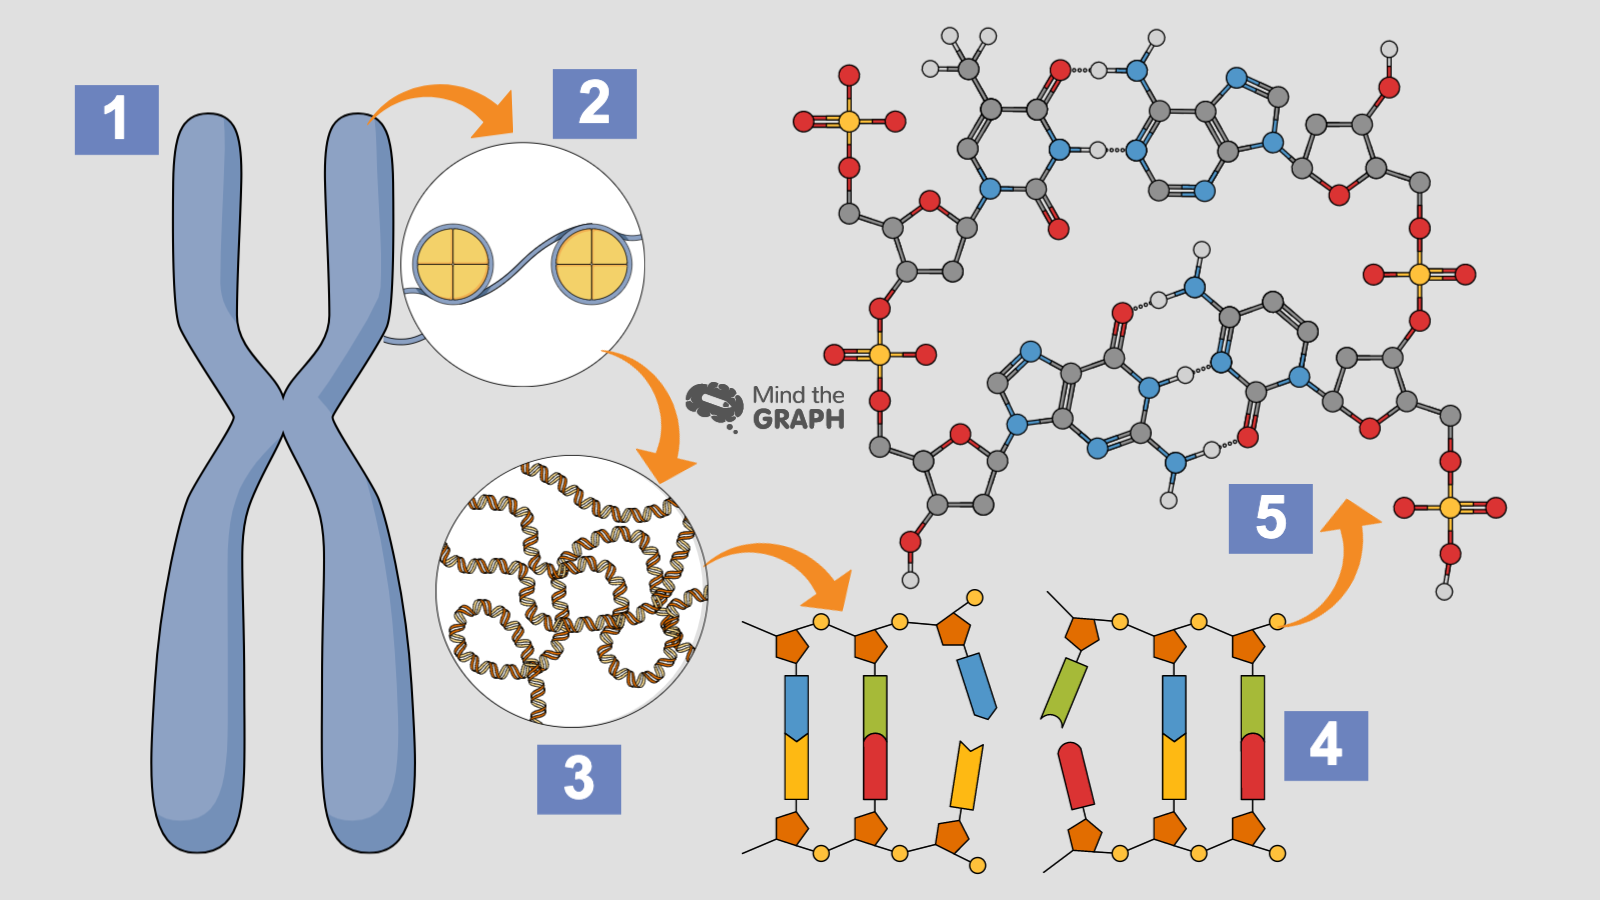
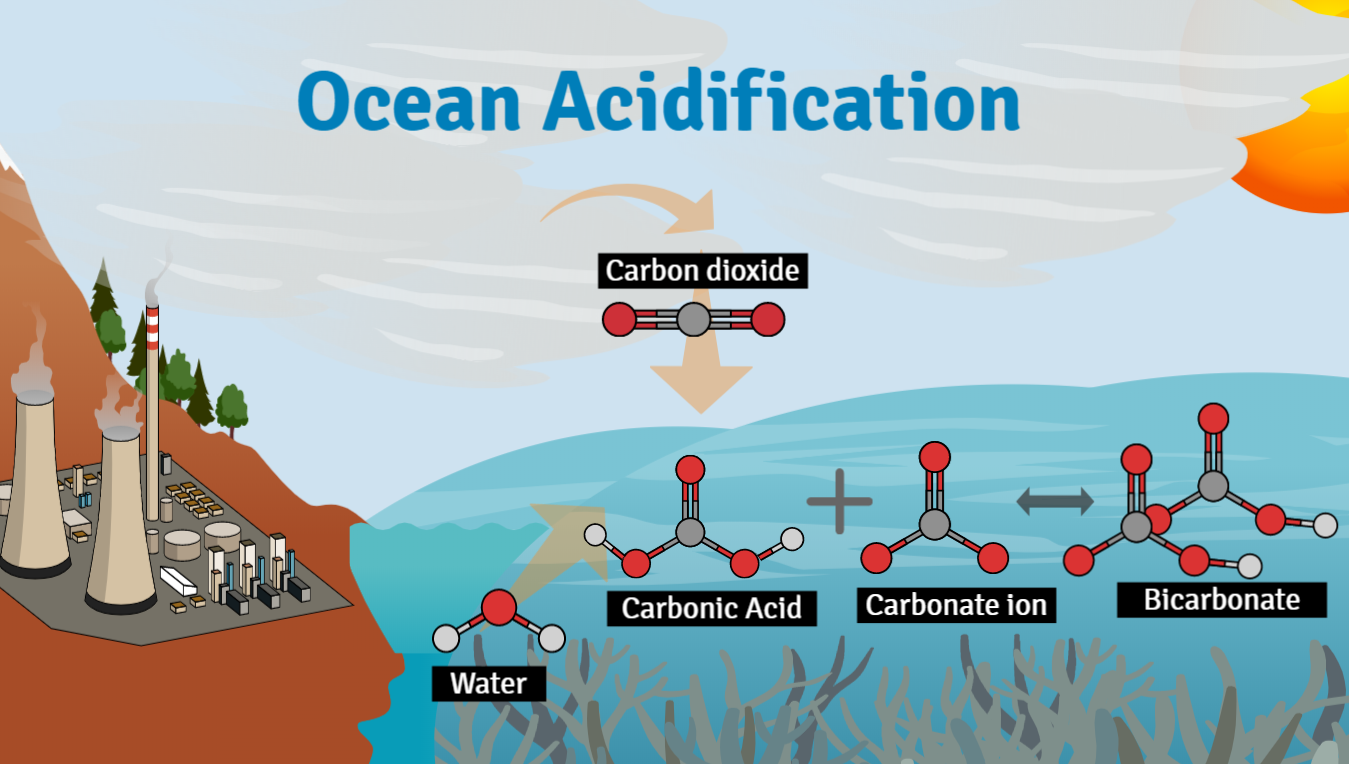
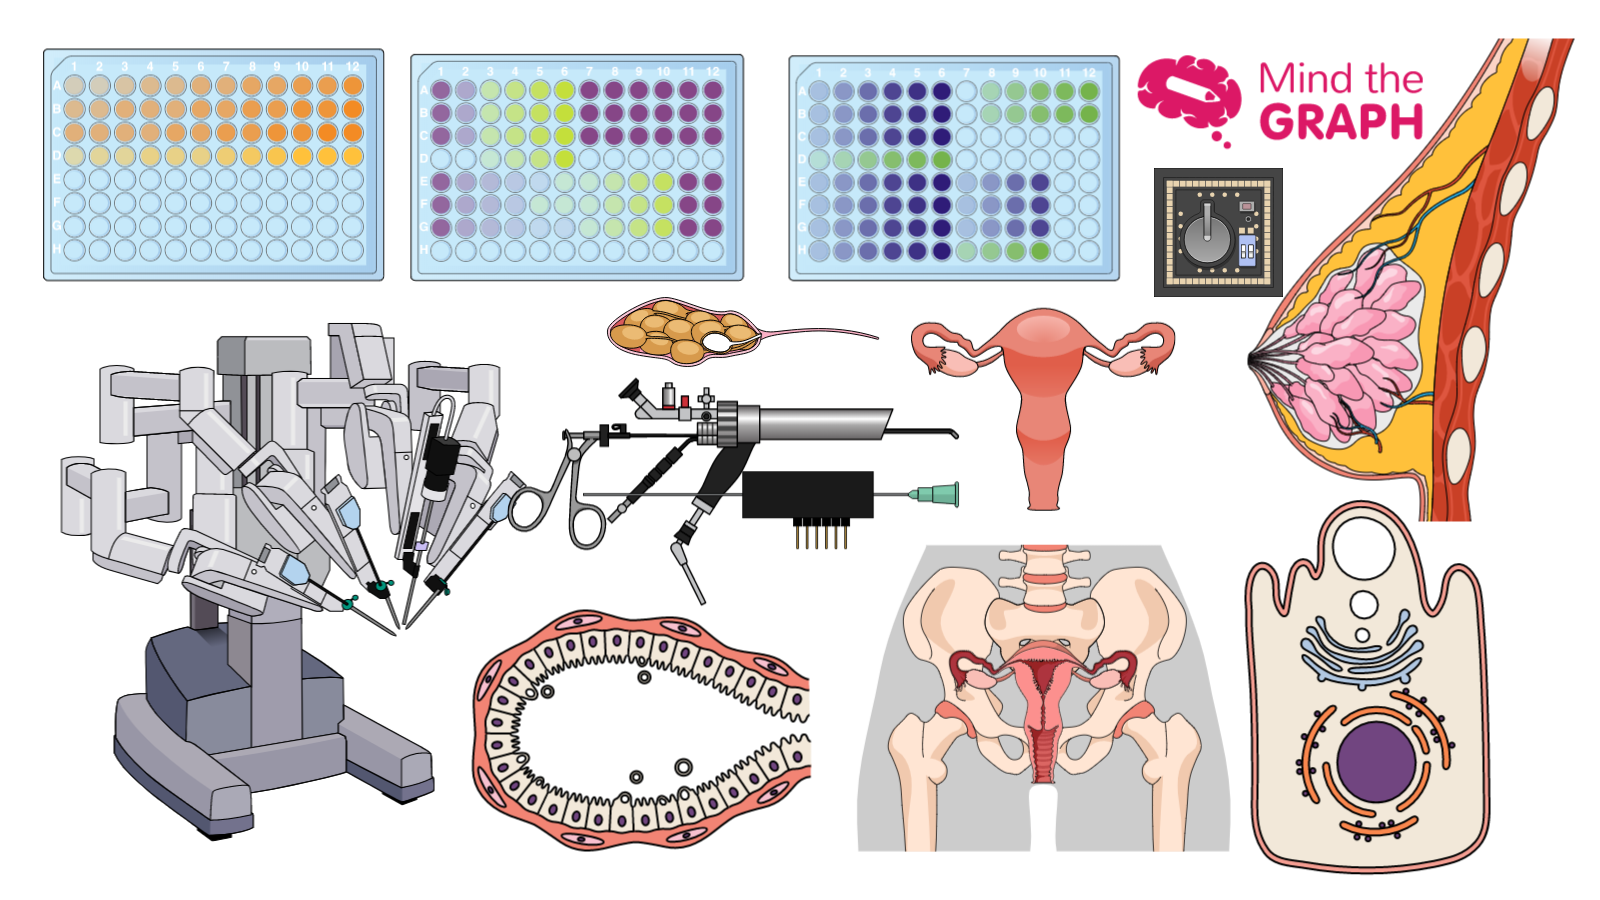
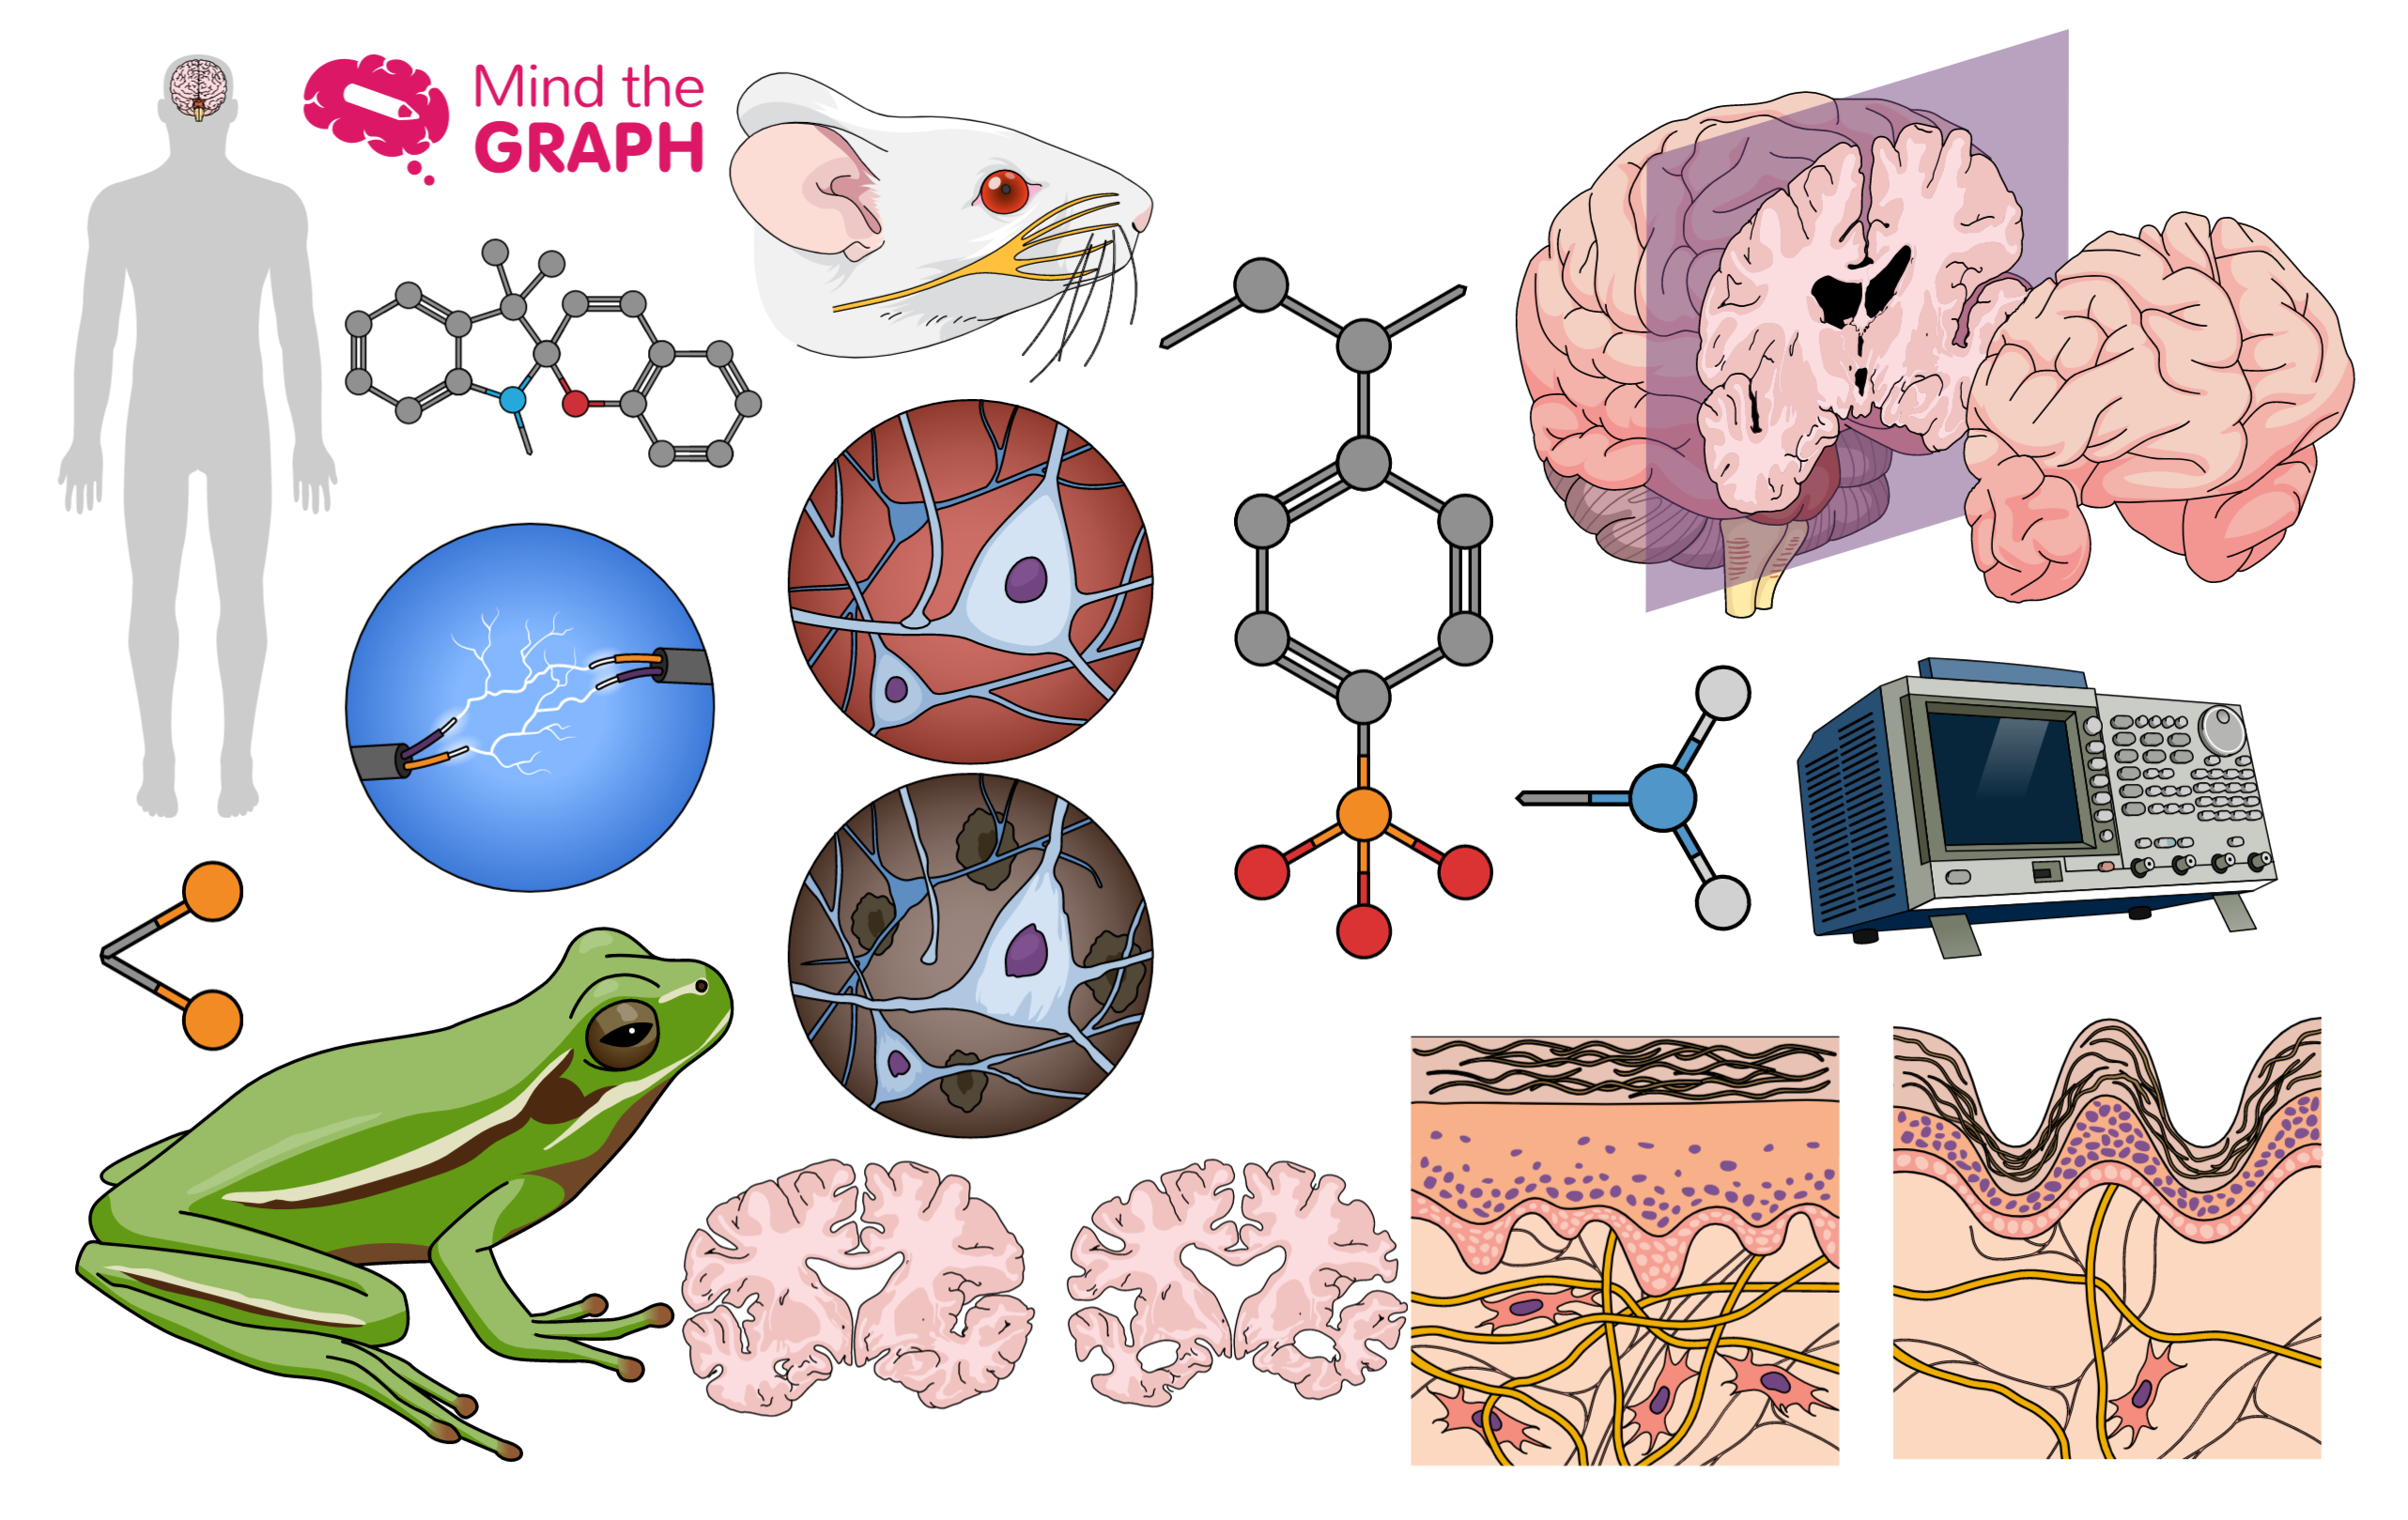
El viernes es el día en que mostramos nuestras nuevas ilustraciones científicas y médicas que permiten [...]
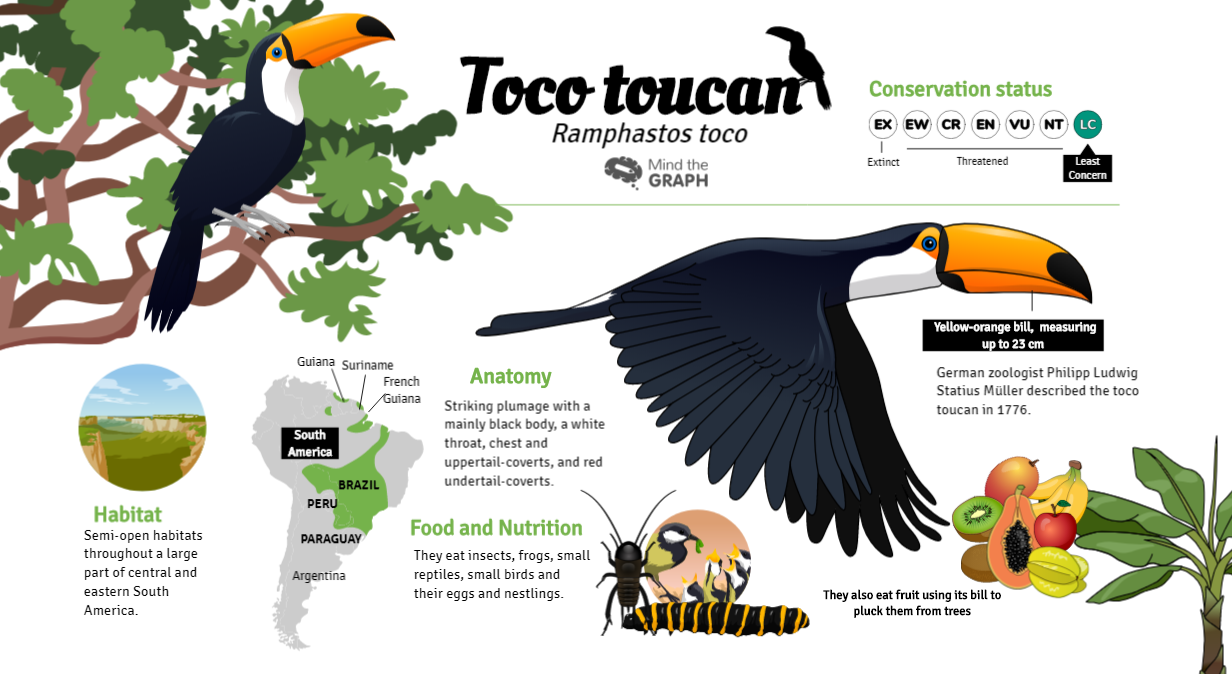
¡Hola! El viernes es un día para mostrar las nuevas ilustraciones científicas. Esta semana hemos añadido varias [...]
¿Explica la ciencia y los temas científicos complejos de forma comprensible? No es una [...]
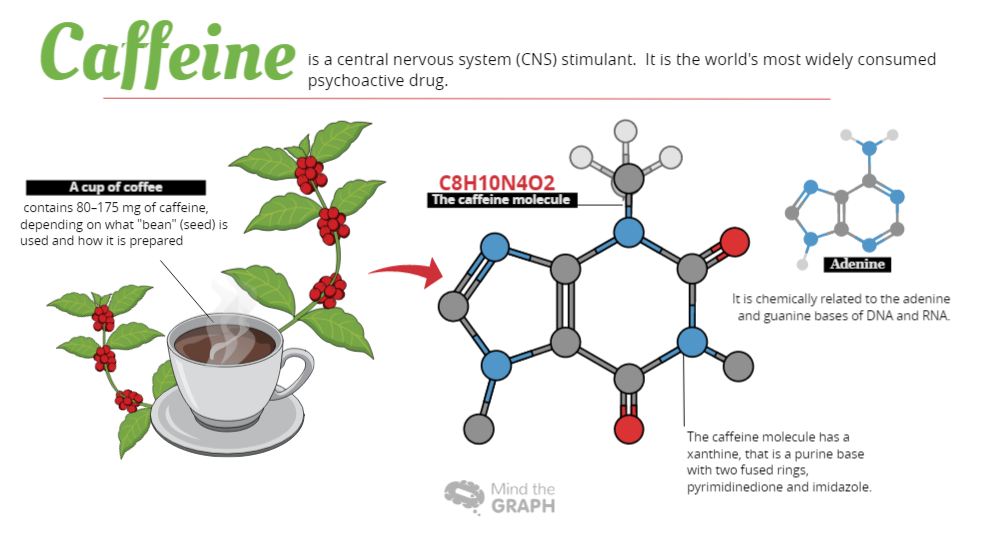
¿Ha tomado un café esta mañana? Una parte de la vida social de un científico es [...]
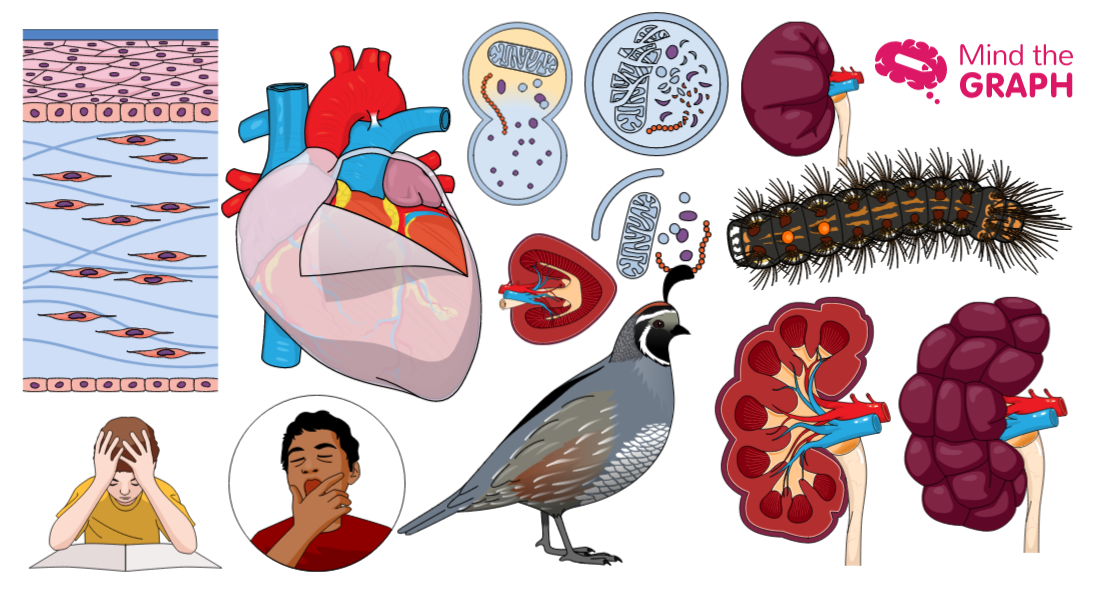
Hola, ha llegado el momento de mostrar las nuevas ilustraciones científicas de Mind the Graph. Ya tenemos [...]
Para comunicar la importancia de la ciencia en nuestra sociedad, primero debemos ser capaces de [...]
Como ya sabe, todas las sextas secciones comparten las nuevas ilustraciones que hemos añadido a Mind the [...]
Como probablemente sepa, Mind the Graph es una plataforma en línea que permite a los [...]
¡Hola! Es la sexta semana de nuevo (YAY). ¿Estás preparado para el fin de semana? O bien, ¿tú [...]