Find the perfect infographic template for you!
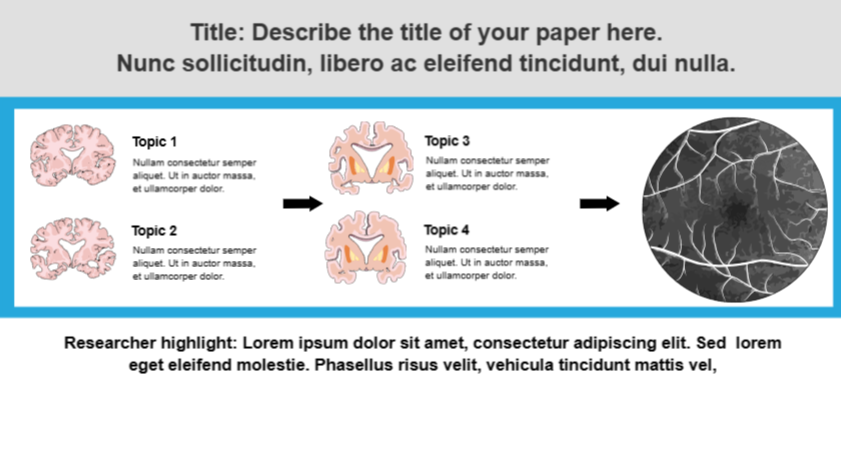
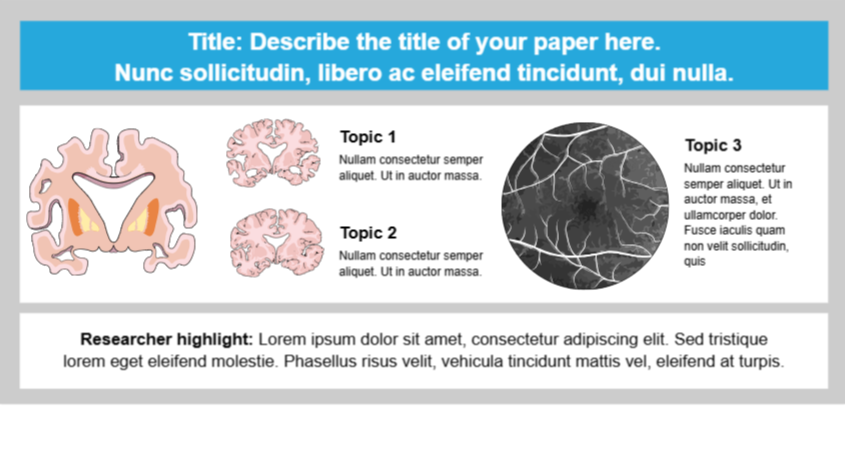
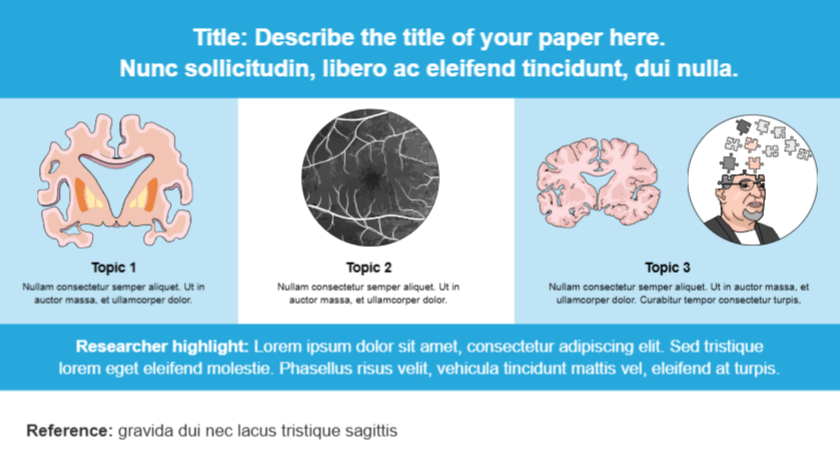
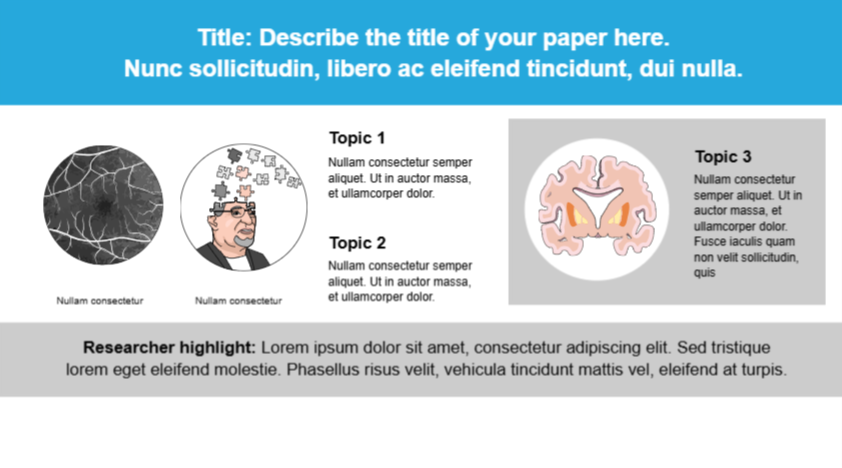
alzheimer disease associated disorders 3
Have a professional infographic and enhance your paper impact with a few clicks
Sign up with Google- Made by scientist for scientists
- 100% fully customizable
- Easy to edit: just drag and drop
- 75.000+ of illustrations available
- Download, present and share easily
Details
The alzheimer disease associated disorders 3 is a great option to highlight your paper's main subject straight away. Illustrate your science, spread your knowledge, and reach a greater audience with the power of infographics. Remember you can custom, download, present and share your work in just a few clicks. This template was made by scientists for scientists.

Tags
Need a more specific infographic template?
If you can't find the perfect template for communicating your research, you can count on our on-demand service. All our presentation templates are made specially for you by professional designers and curated by our science team.
Learn more
Mind the Graph is a team of designers and scientists, with the dream of
simplifying and spreading visual scientific communication across the globe.
We care about your success with visual communication and scientific education.
Our goal is to help scientists and researchers clearly communicate their ideas and
findings with no effort, using accurate and impactful visuals.