3分钟阅读
10/01/2025
Mind The Graph科学博客旨在帮助科学家学习如何以一种简单的方式交流科学。
Great academics know that powerful visuals can transform research—but not all tools give you that creative freedom. That’s why we’re proud to unveil PowerEdit, our breakthrough figure editing tool for Mind the Graph. Now, you can craft publication-ready visuals that are as precise and compelling as your science. Why Visuals Matter in Research (and Why […]
A scientific poster is an important and widely used format for sharing research in academic […]
Creating compelling scientific illustrations shouldn’t require a PhD in graphic design or drain your research […]
Research design is the backbone of any successful study—it’s the structured plan that guides how […]
Generative AI tools are transforming how researchers and students write, yet many still face uncertainty […]
As social media grows noisier, infographics in social media have become one of the most […]
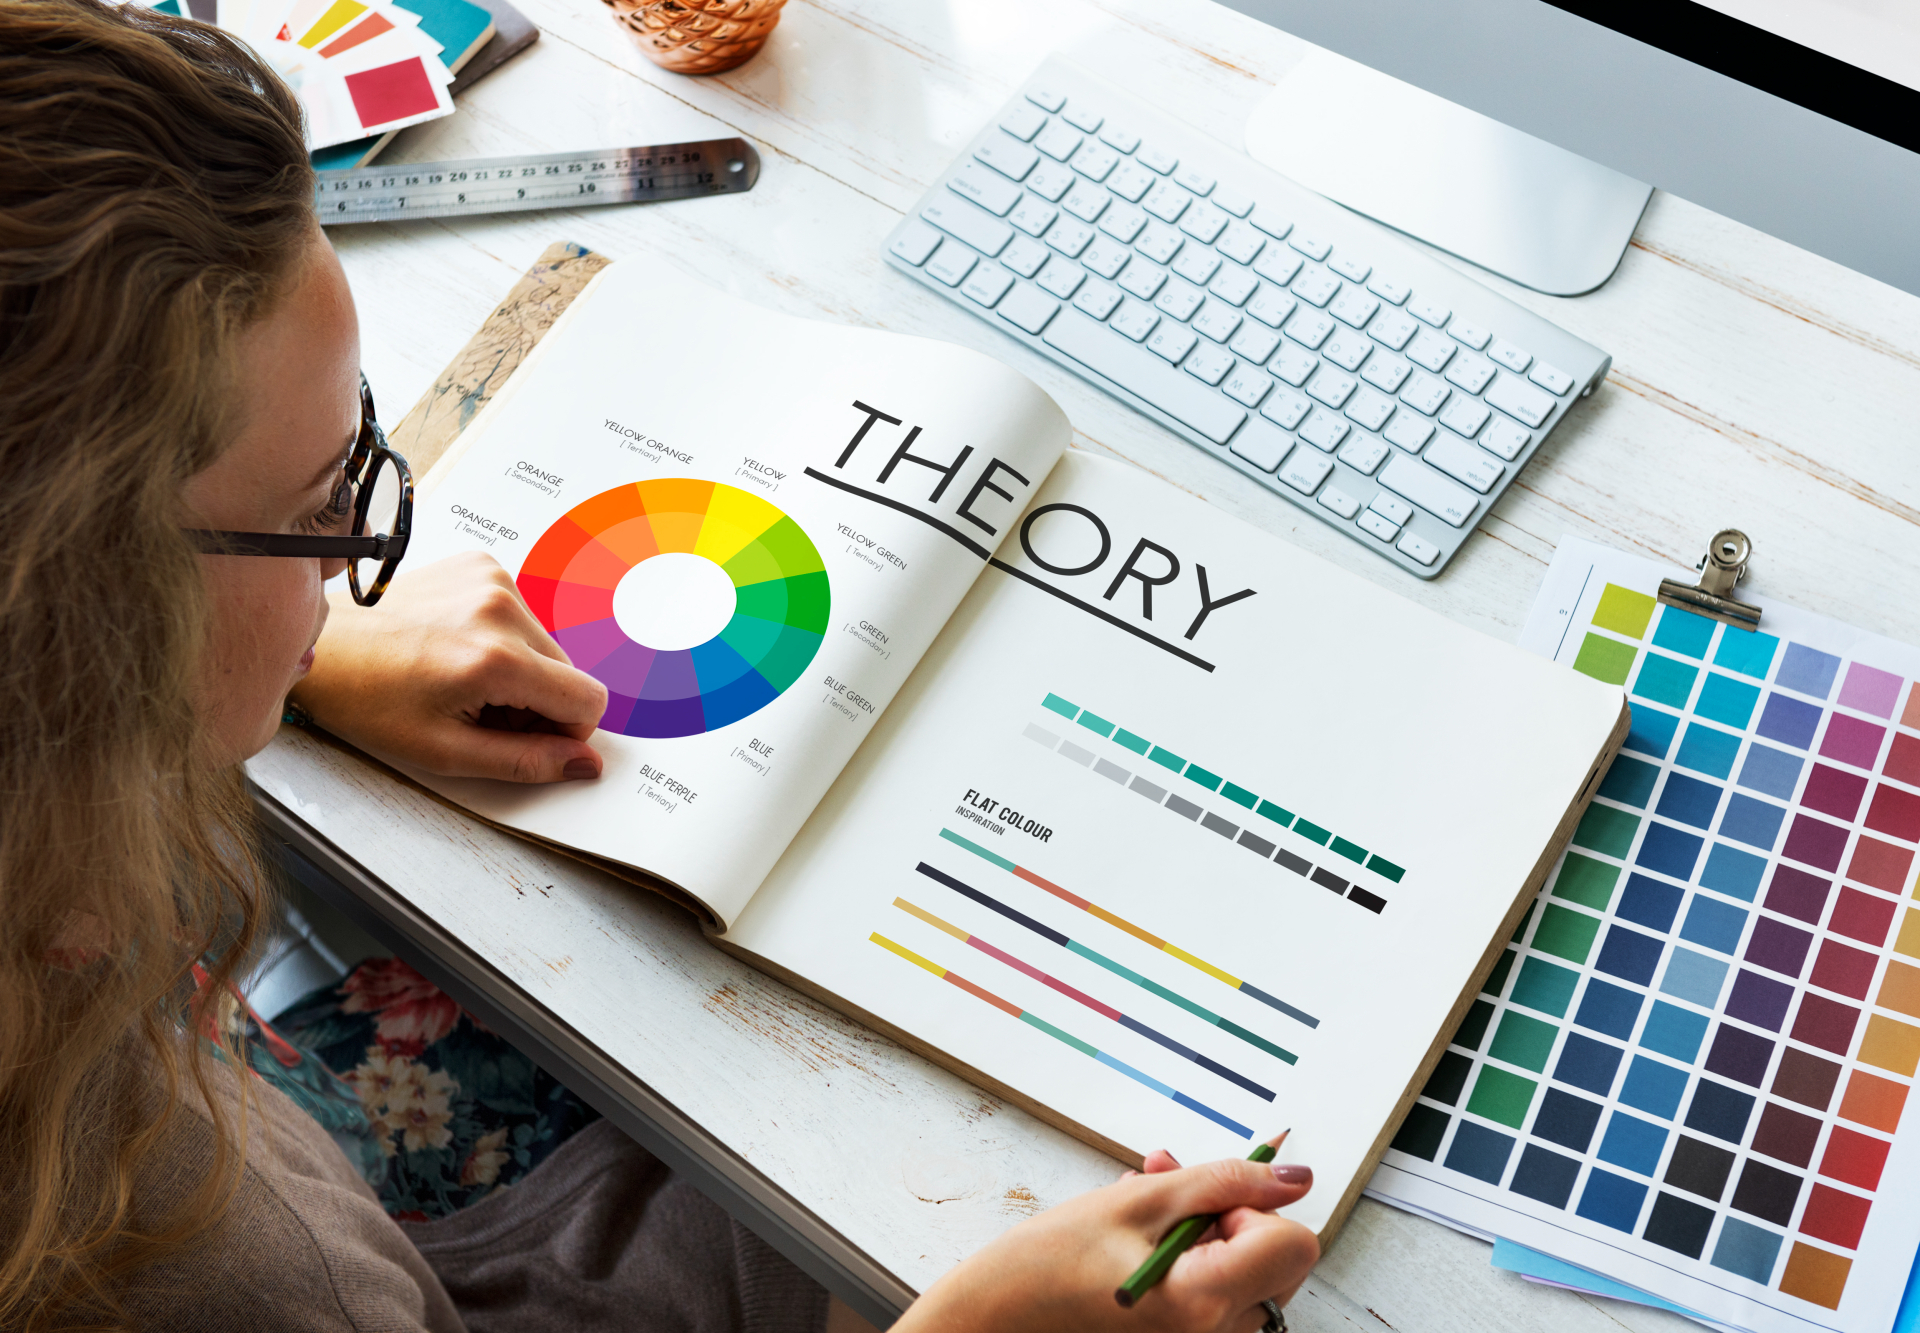
色彩是生活和科学的重要组成部分。它可以吸引你的注意力,唤起 [...] 你的注意。
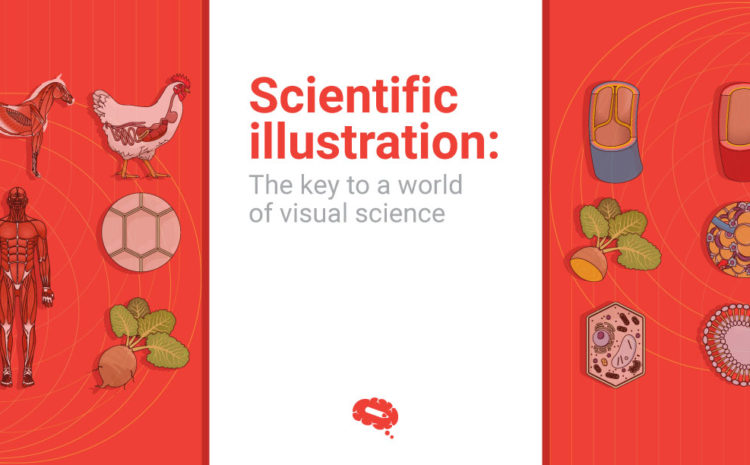
科学插图被视为一种通用语言,可以跨越学科和地域的鸿沟。[...]
人工智能(AI)正以惊人的速度改变着药物研发。从设计新型分子 [...]
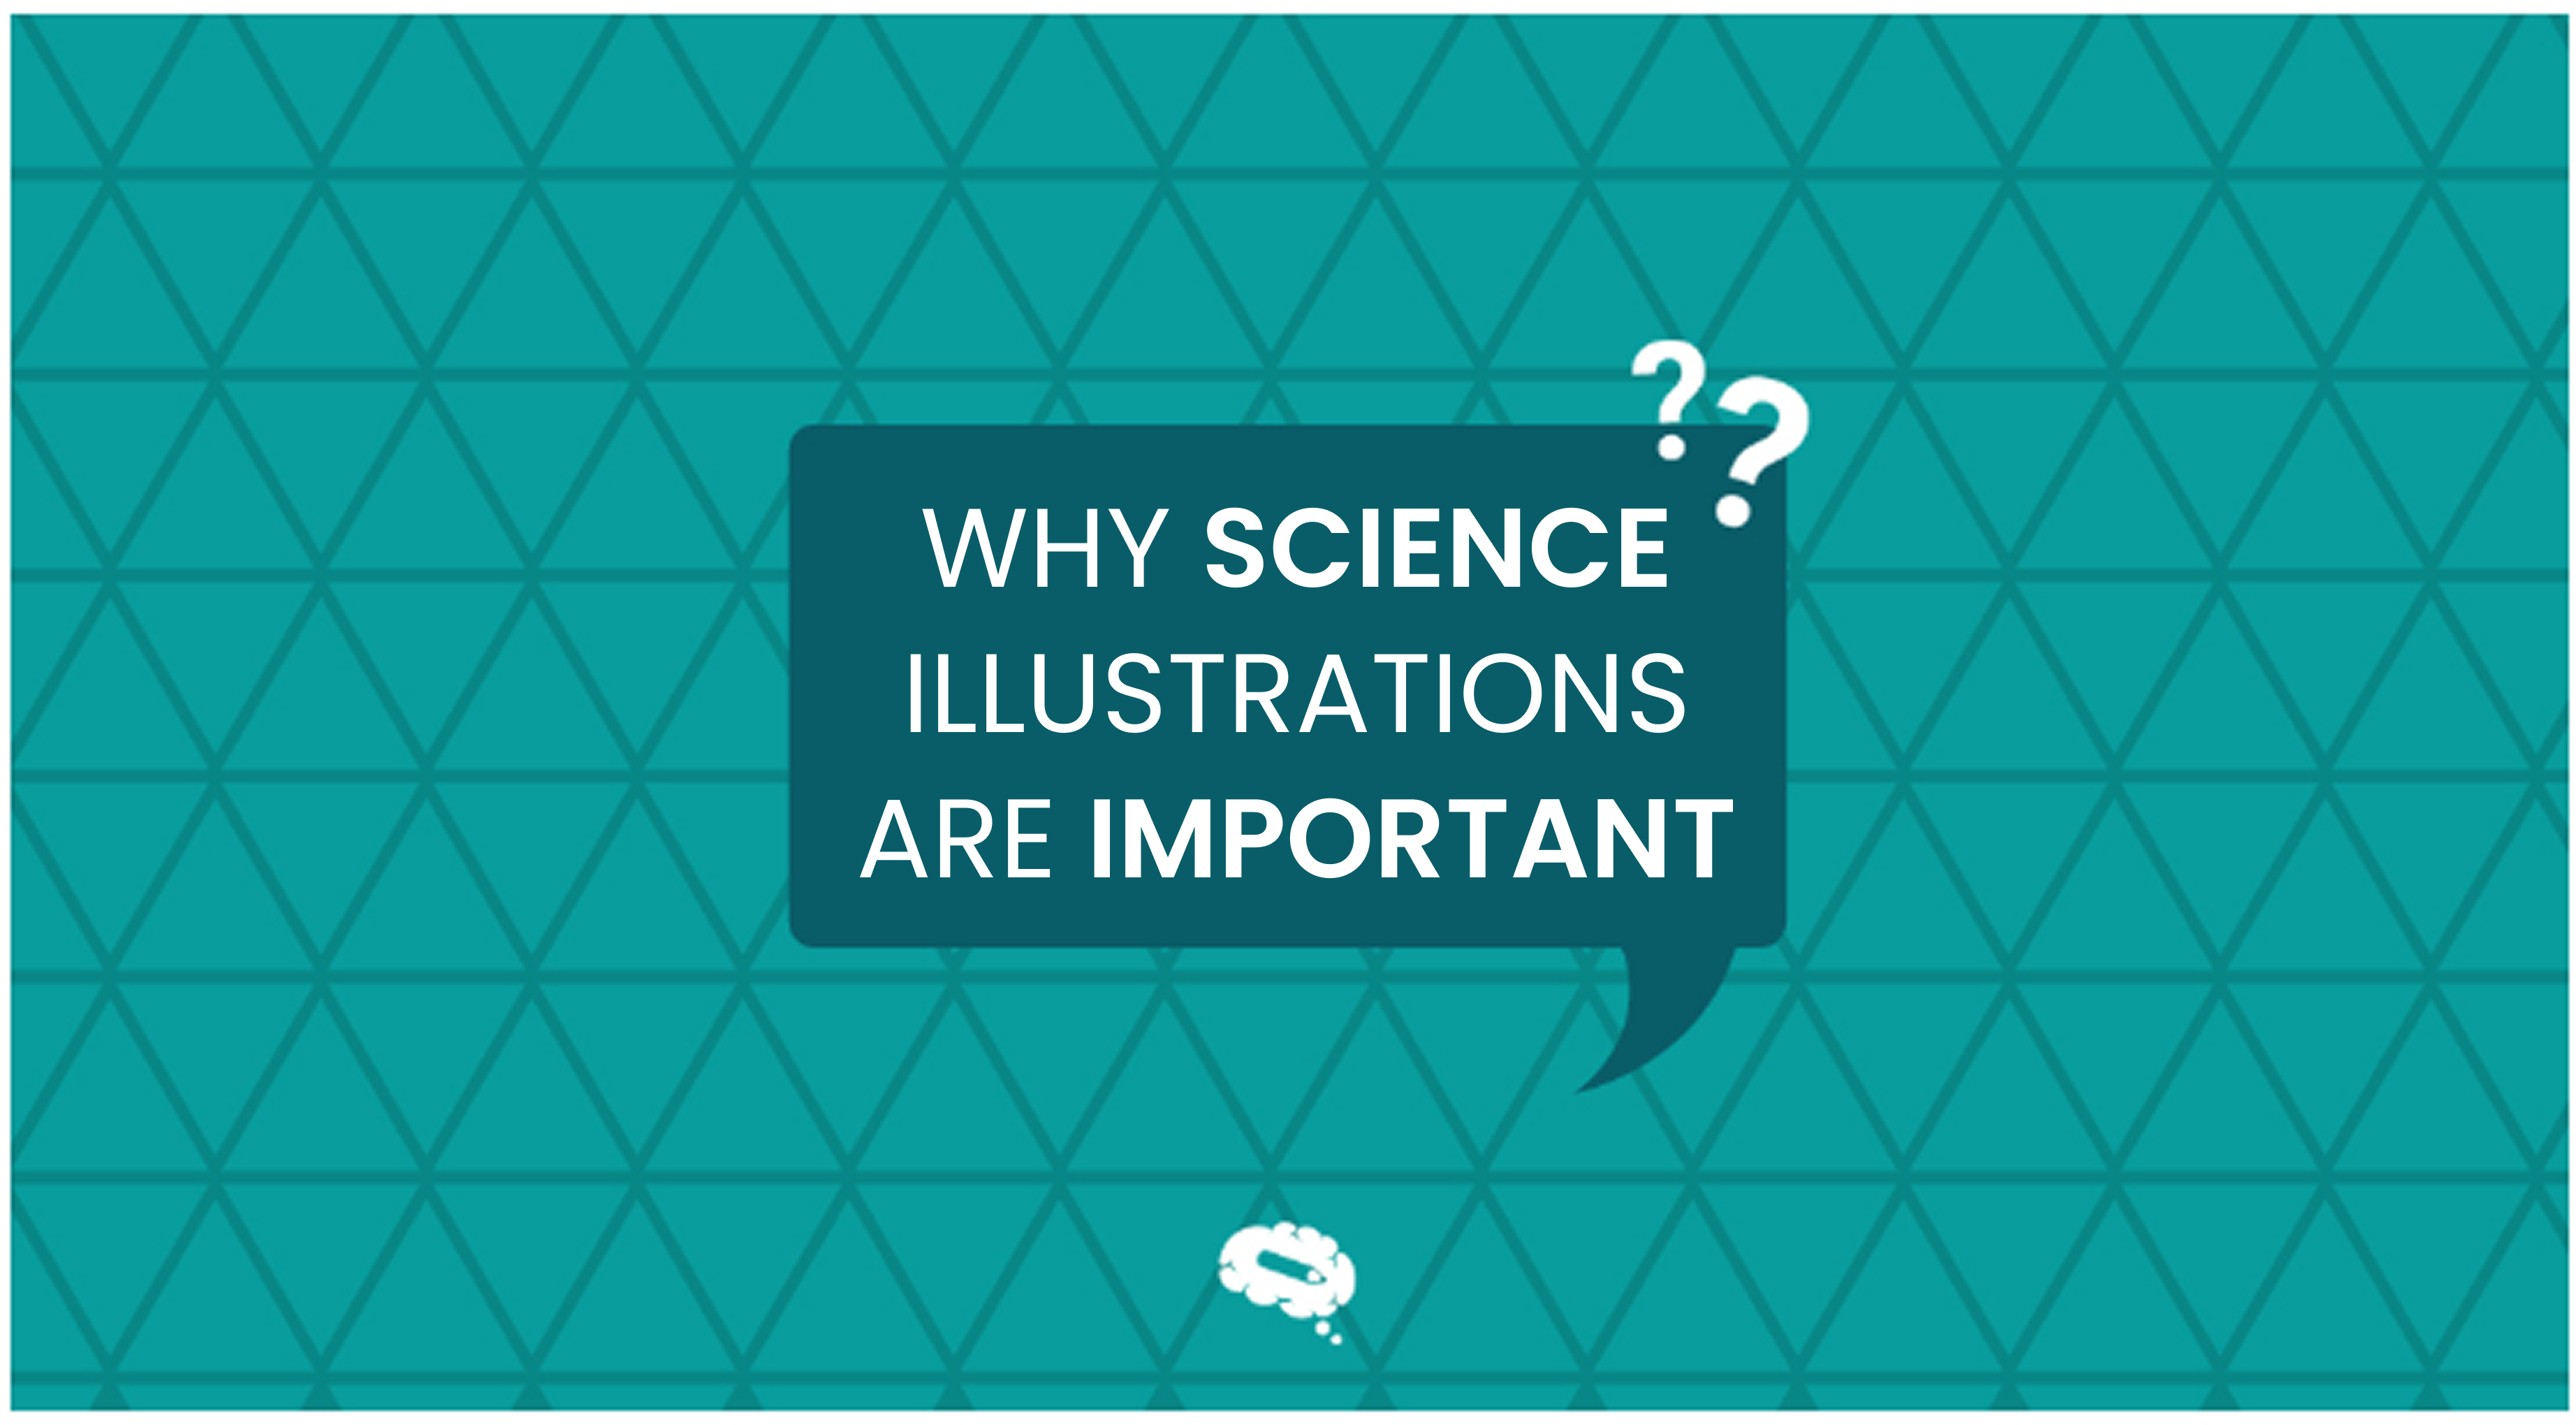
为什么科学绘画在科研中比以往任何时候都更重要 在当今快节奏的科学领域,出版 [...]
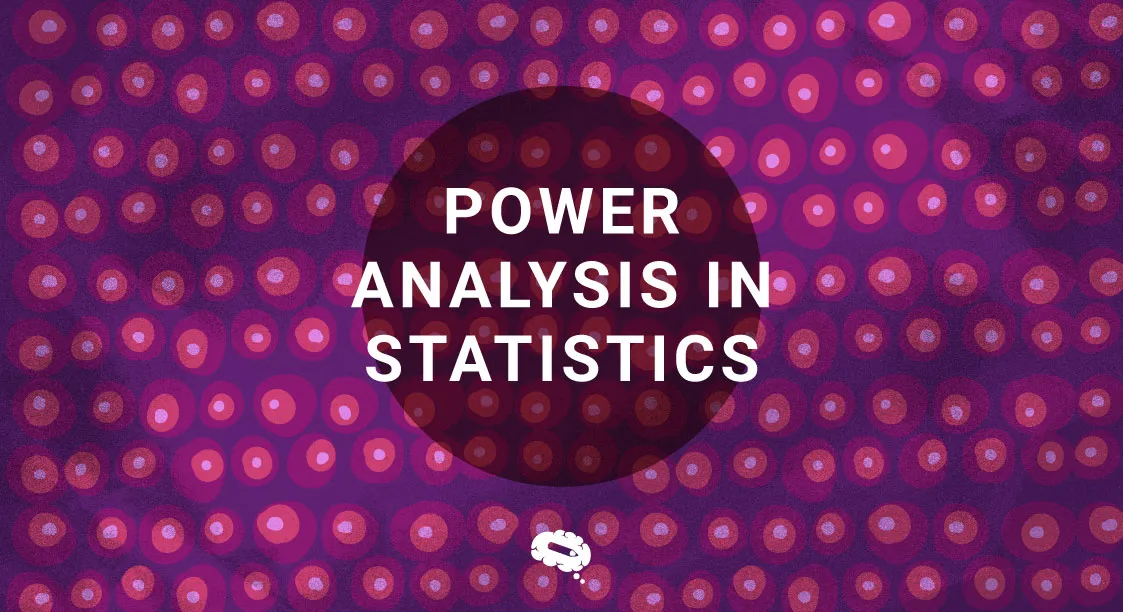
了解统计学中的功率分析如何确保结果准确并支持有效的研究设计。
了解方差分析 (ANOVA)、其类型、应用以及如何提高统计研究的准确性。
了解比较研究如何通过增强研究分析和决策的方法来发现真知灼见。