Great academics know that powerful visuals can transform research—but not all tools give you that creative freedom. That’s why we’re proud to unveil PowerEdit, our breakthrough figure editing tool for Mind the Graph. Now, you can craft publication-ready visuals that are as precise and compelling as your science.
Why Visuals Matter in Research (and Why Editing Them Should Too)
Clear, professionally designed research figures boost reader engagement, improve comprehensibility, and even influence citation rates. Buna göre MDPI, well-crafted visuals help research papers stand out and resonate more with audiences. Separate araştırma shows that high-quality figures are also likely to increase the chance of acceptance in scientific journals—because clarity signals academic rigor.
Creating publication-ready visuals is not just about presentation; it’s about revealing the unseen patterns, insights, and trends in complex datasets that text alone can’t properly convey. This makes creating powerful and accurate scientific illustrations that convey your research story an essential skill for academics to master.
Yet academics looking to create research figures are frequently left struggling with rigid templates, inaccessible diagram elements, or generic visualization tools that are unable to adapt to scientific complexity. That’s the gap Mind the Graph’s new PowerEdit figure editing tool fills.
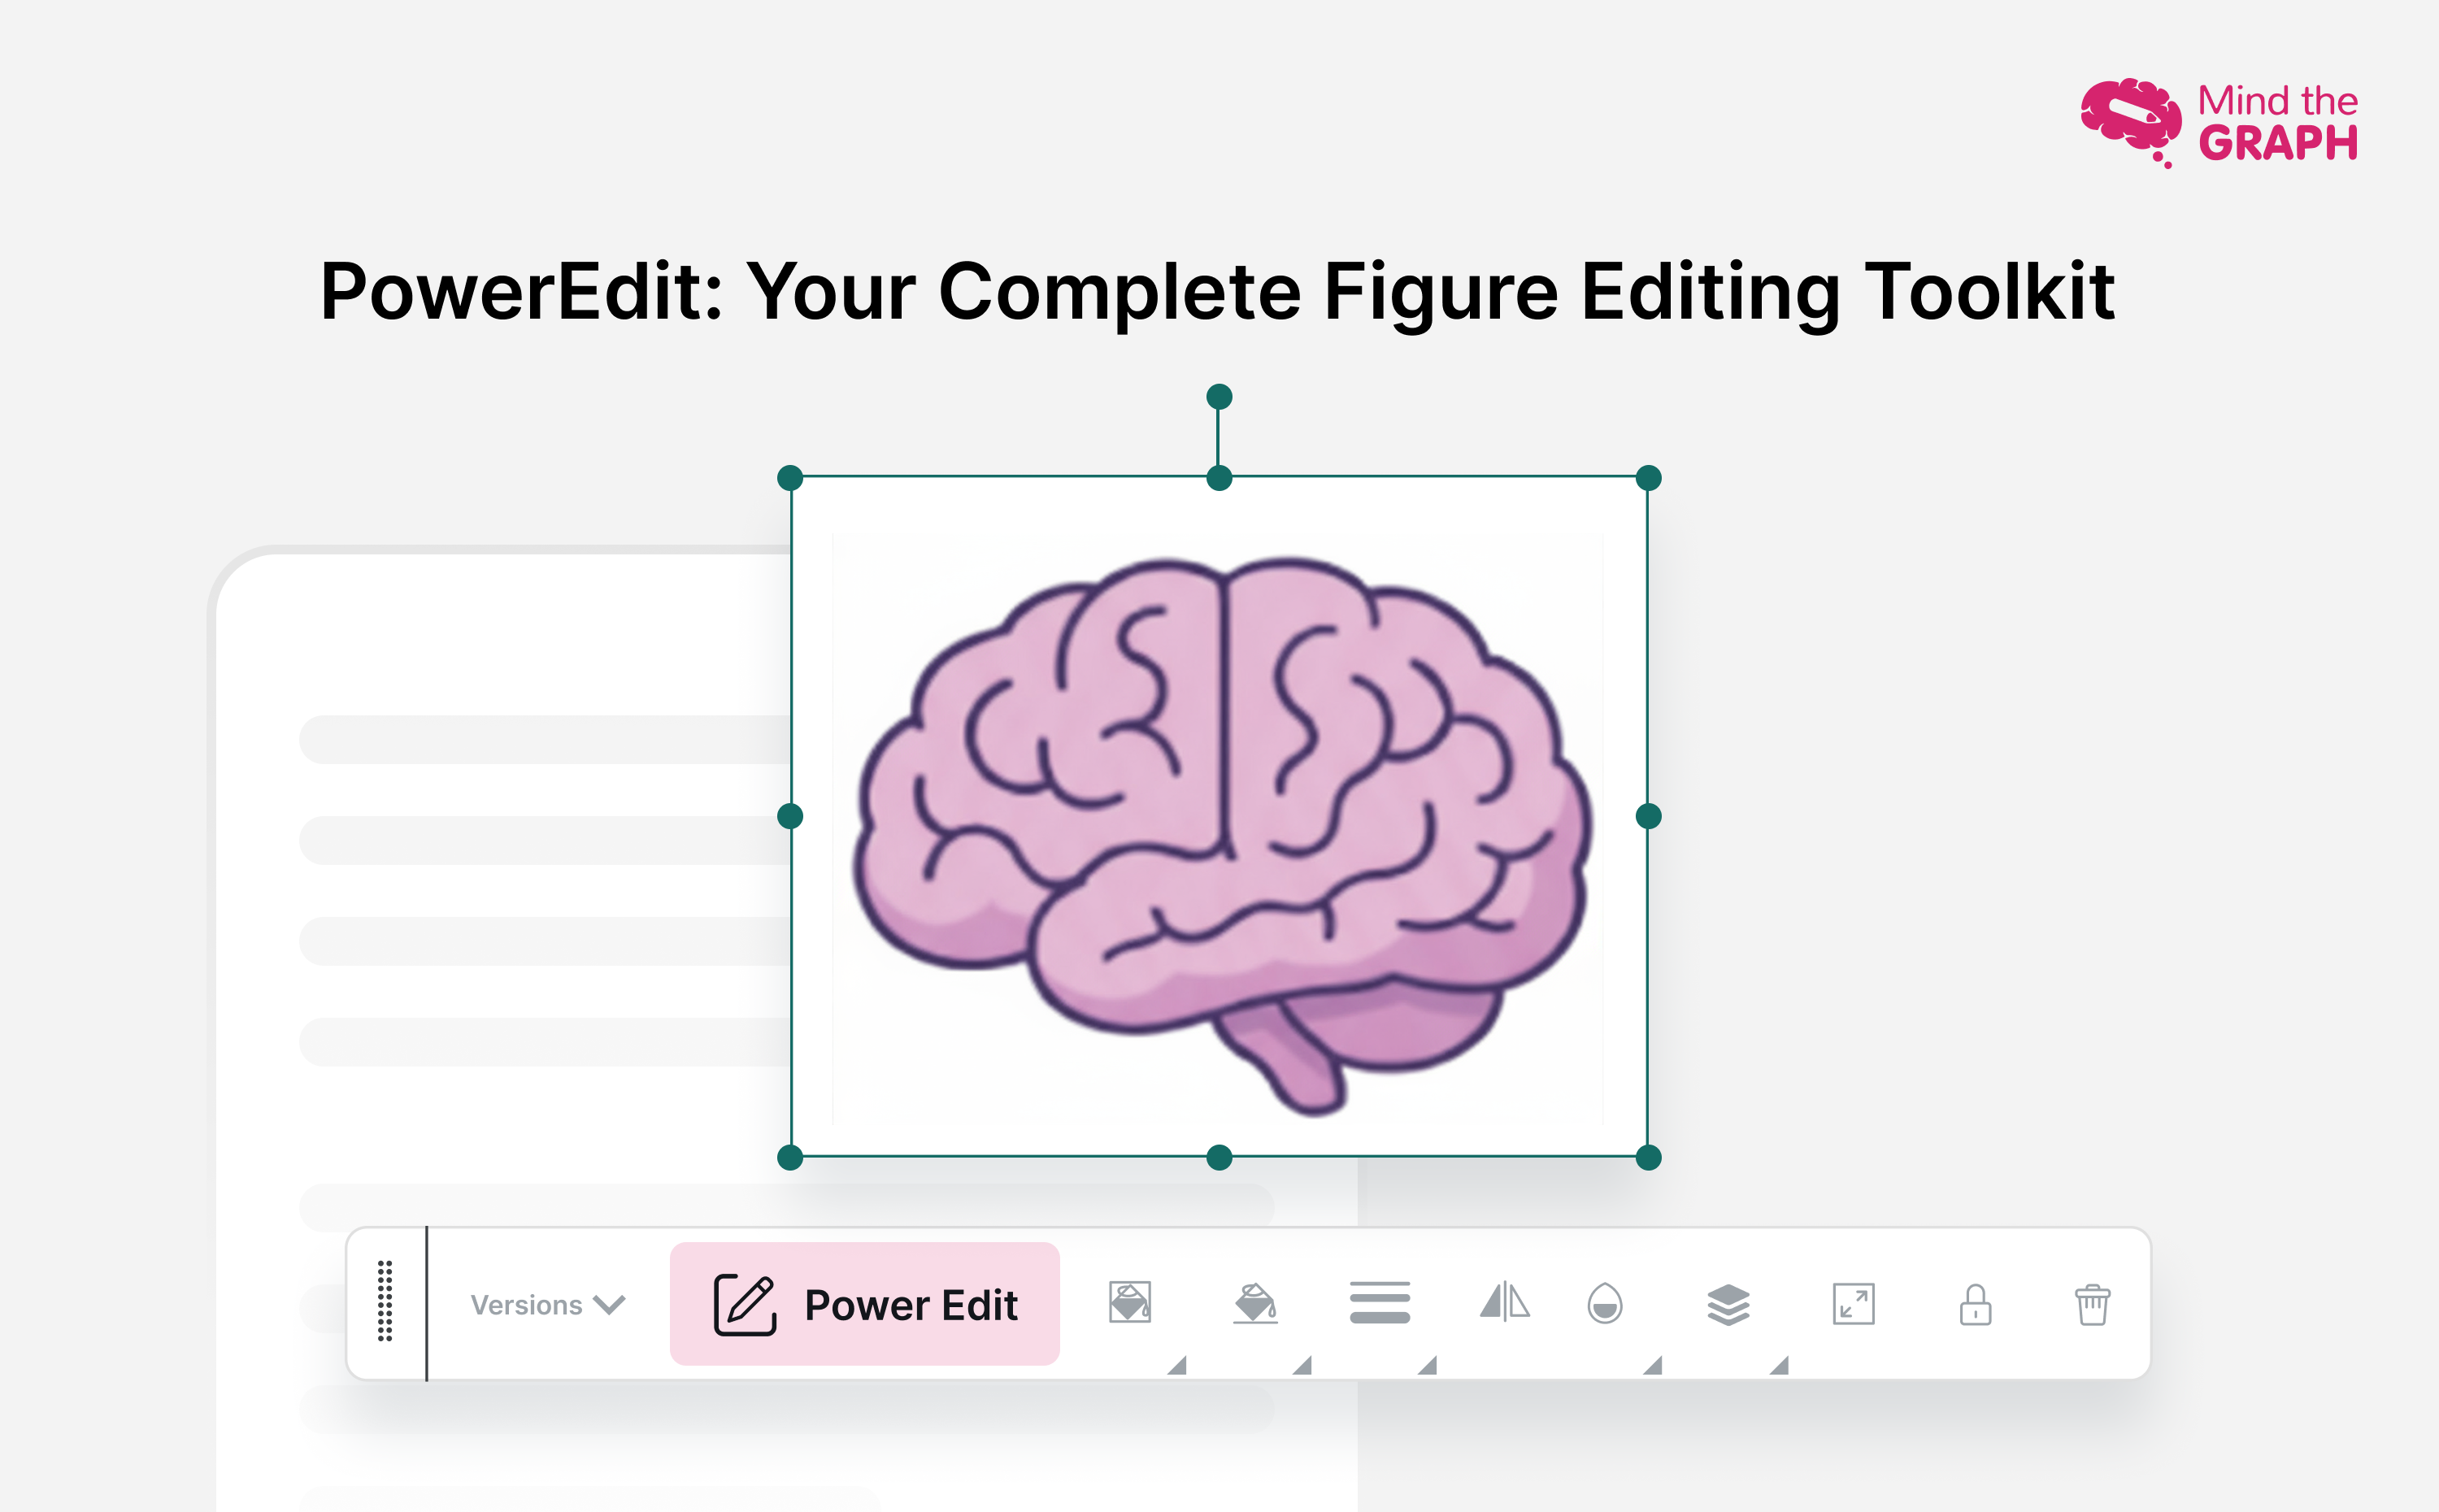
Meet PowerEdit: Your Complete Figure Editing Toolkit
With PowerEdit, you can transform any Mind the Graph illustration into a powerful research figure that reflects your work, your voice:
- ✂ Edit without limits — Unlock icons, parts, and layers for full customization.
- 🎨 Polish instantly — Adjust colors, styles, and scale with surgical precision.
- ➕➖ Remix effortlessly — Add, remove, or recombine visual elements to suit your needs.
- ⚡ Work faster than ever — Create publication-ready visuals in minutes, not hours.
How to Use PowerEdit on Mind the Graph?
When you add an illustration to your canvas on Mind the Graph, you’ll see a toolbar appear above it. In this toolbar, look for the PowerEdit button to edit your research figures.
- Step 1: Click PowerEdit
Once you click on PowerEdit, the scientific illustration will automatically break down into its individual elements.
- Step 2: Edit Elements Individually
You can now:- Change the colors of specific parts
- Adjust Hizalama
- Modify the şekil
- Or even remove elements you don’t need
- Step 3: Regroup Your Illustration
After making your edits, simply click the Group button to put the elements back together into a single scientific illustration.
- Step 4: Place on Canvas
Finally, move and resize your edited illustration on the canvas as you like.
With PowerEdit, you get complete control to customize research figures and illustrations and make them perfectly match your scientific story.
See PowerEdit in Action
▶️ Watch the demo to see how effortlessly PowerEdit turns standard illustrations into publication-ready visuals.
How Can PowerEdit Benefit Researchers?
Mind the Graph’s PowerEdit feature is more than a convenience—it’s a productivity multiplier and clarity enhancer İşiniz için.
- Speed and efficiency: Edit 5x faster ve save up to 70% of time per figure with direct in-app customizations. No more recreating visuals from scratch or exporting to design tools.
- Accuracy with impact: Unlock unlimited flexibility; retain details such as measurement units or layered elements with fidelity. Change colors, shapes, alignment, or remove elements to edit your research figures instantly.
- Stronger publications: Well-designed scientific illustrations and research figures ensure clarity, help you convey ideas with precision, and build reader trust.
This isn’t just another feature, it’s the creative leverage researchers have been waiting for!
Try PowerEdit now and bring precision, agility, and professionalism to every research figure.
We value your input. Let us know how PowerEdit improves your visual workflow or share examples of its impact in your latest papers. If you have any questions or ideas on how we can make Mind the Graph even better for you, write to us at contact@mindthegraph.com. We’d love to hear from you!
Mind the Graph is an easy-to-use visualization platform for researchers and scientists that enables fast creation of precise publication-ready graphical abstracts, infographics, posters, and slides. With 75,000+ scientifically accurate illustrations made by experts and hundreds of templates across 80+ major research fields, you can produce polished visuals in minutes — no design skills required.

Haber bültenimize abone olun
Etkili görseller hakkında özel yüksek kaliteli içerik
bilimde iletişim.