Introduction
Let’s dive in and learn how to create a graphical abstract for the Journal of Social Issues? The Journal of Social Issues (JSI) is a peer-reviewed academic journal focused on social psychology and a wide range of contemporary social problems. Established in 1945 by the Society for the Psychological Study of Social Issues (SPSSI), the journal publishes research with practical implications for social policy and human welfare.
Each issue revolves around specific themes, bringing together interdisciplinary scholarship that examines psychological, social, and cultural dimensions of modern challenges like inequality, discrimination, and environmental justice.
Why Use a Graphical Abstract for Journal of Social Issues?
Social issues presented and researched for the Journal of Social Issues are groundbreaking research that would touch the lives of common people in one or the other way. What if we told you that you could make the message reach the community in a concise pictorial manner? Yes, graphical abstract! But how do you create a graphical abstract for the Journal of Social Issues?
Let us walk you through the whole process. Tighten your seat belt your next article for the Journal of Social Issues is getting some good graphical abstracts!
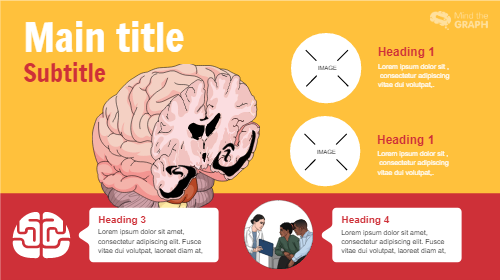
Create a graphical abstract for journal of social issues using Mind the Graph
Step-by-Step Guide: How to Create a Graphical Abstract for Journal of Social Issues
Step 1: Understand the Guidelines
You must link to the Journal of Social Issues author guidelines. Please read the guidelines here. Before you start preparing a graphical abstract, summarize key points relevant to graphical abstracts. Read your research article once with a peaceful mind. Write down critical points that you want to convey to the reader. Then plan your content. This is especially important for researchers submitting to the Journal of Social Issues, as graphical abstracts enhance visibility and impact.
Step 2: Plan Your Content
Once you have an idea of what to include in the graphical abstract, ask yourself the following questions:
- Is the content representative of your study?
- Are the points selected part of a novel process you developed?
- Do these points reflect key findings or conclusions?
- Would including any information from your literature review add value?
- Can any points be simplified or removed?
- Does the abstract form a coherent story?
These answers will help guide the structure of your graphical abstract, which should align with the Journal of Social Issues guidelines.
Answers to these questions would lead you to prepare a story that you want to present to the reader. Make sure you adhere to the author’s guidelines while you finalize the context that you want to accommodate in the graphical abstract.
Step 3: Choose Your Tools
Once you have your story with you, now is the time to choose the tool that you want to use for making the graphical abstract. Software tools like Mind the Graph, Adobe Illustrator, Canva, Biorender, etc. are available in the market to make your process easier. You can choose from them based on your requirements.
Create a graphical abstract for journal of social issues using Mind the Graph
There are paid tools and free software available too for ease of making the graphical abstract. Depending on your need and your level of expertise, feel free to opt for a choice and then move to the designing part of the graphical abstract making.
Step 4: Design Your Visuals
The article from PLOS Computational Biology emphasizes several best practices for designing visually appealing and informative graphics in scientific communication. The key design principles of effective graphics are clarity, simplicity, and accessibility. Designs should be clean and minimalistic, avoiding unnecessary complications or decorative art to show a message. Designers should use consistent colors and fonts to guide the reader through the elements of the figure, logical groupings of data, and clear labels and legends that enhance comprehension.
The choice of visualization should align with the type of data being presented: bar charts for comparisons, and scatter plots for correlations. Also, the access will involve things such as using colorblind-friendly palettes and high contrast for readability. All in all, visuals should be crafted to convey the intended message efficiently in such a way that understanding is enhanced rather than overloaded or misled.
Step 5: Review and Revise
At times when we create something it seems the best to us, but we know that’s not true. Right? A research article needs to be peer-reviewed and revised based on feedback. Similarly, a graphical abstract needs to be peer-reviewed. Ask your friends to describe what your graphical abstract looks like to them. Is it conveying the information that is intended? or not? Ask them to be honest in giving you feedback (Caution: We may lose a friend over the peer review process, so when you receive feedback see it with an open mind).
Step 6: Submission
All the former steps will take you to the final phase of the process. Properly format and submit your graphical abstract to the Journal of Social Issues. Wait for the response from the reviewer and improve the graphical abstract based on their comments.
Common Pitfalls to Avoid
At times we tend to overload the graphical abstract with a lot of information. We suggest you avoid that. Keep it simple and focused. Avoid using too many icons or too few icons/images for the content. Adhere to the journal guidelines strictly. Do not miss on following the instructions. For further guidelines, you can refer to our other articles in the blog here. Our blog would help you find guidance regarding the choice of icons, our scheme, and the use of template format for the graphical abstract making.
Conclusion
A well-crafted graphical abstract can be a true game change for the acceptance of the article in the journals too. Not just that it increases the visibility of the article in scientific and non-scientific communities. Follow our step-by-step guidelines to prepare stunning graphical abstracts and maximize the impact of your research.
Crafting Exceptional Graphical Abstracts with Mind the Graph for the Journal of Social Issues
Mind the Graph is an intuitive and powerful tool designed specifically for scientists, researchers, and professionals aiming to create high-quality graphical abstracts. It offers a wide range of customizable templates and scientifically accurate illustrations that simplify the process of turning complex data into visually compelling stories. With its user-friendly interface, Mind the Graph allows users to easily design clear, impactful graphical abstracts that meet the rigorous standards of academic journals like the Journal of Social Issues. Additionally, the platform supports collaborative work, enabling teams to seamlessly create and edit visuals together. Mind the Graph ensures that each graphical abstract is not only scientifically sound but also visually appealing, enhancing the reach and engagement of your research.


Subscribe to our newsletter
Exclusive high quality content about effective visual
communication in science.


