3 min de lecture
08/28/2018
Le blog scientifique Mind The Graph a pour but d'aider les scientifiques à apprendre à communiquer la science d'une manière simple.
Une fois que tout le travail a été fait et relu quelques centaines de fois, le moment tant attendu arrive : il est temps de soumettre votre article scientifique ! C'est un long chemin bien connu. Mais les chances que votre article soit accepté du premier coup sont faibles, alors préparez-vous aux étapes suivantes : Regardons de plus près [...]
Si vous pensez que publier un article est le seul moyen d'obtenir de la visibilité pour votre [...].
Lorsque le sujet est l'information, combiner chiffres et textes n'est pas une tendance. Appeler cela infographie [...]
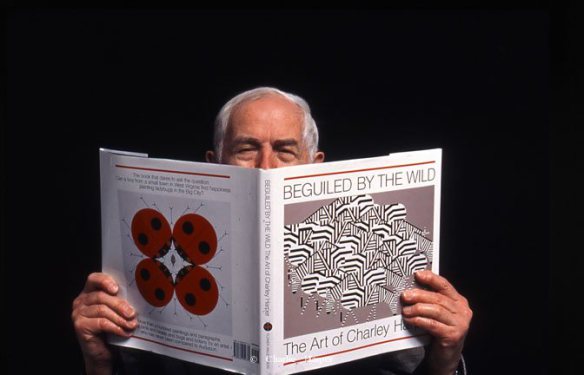
Référence en matière de visualisation de données, Alberto Cairo est l'un des plus grands noms en matière de [...].
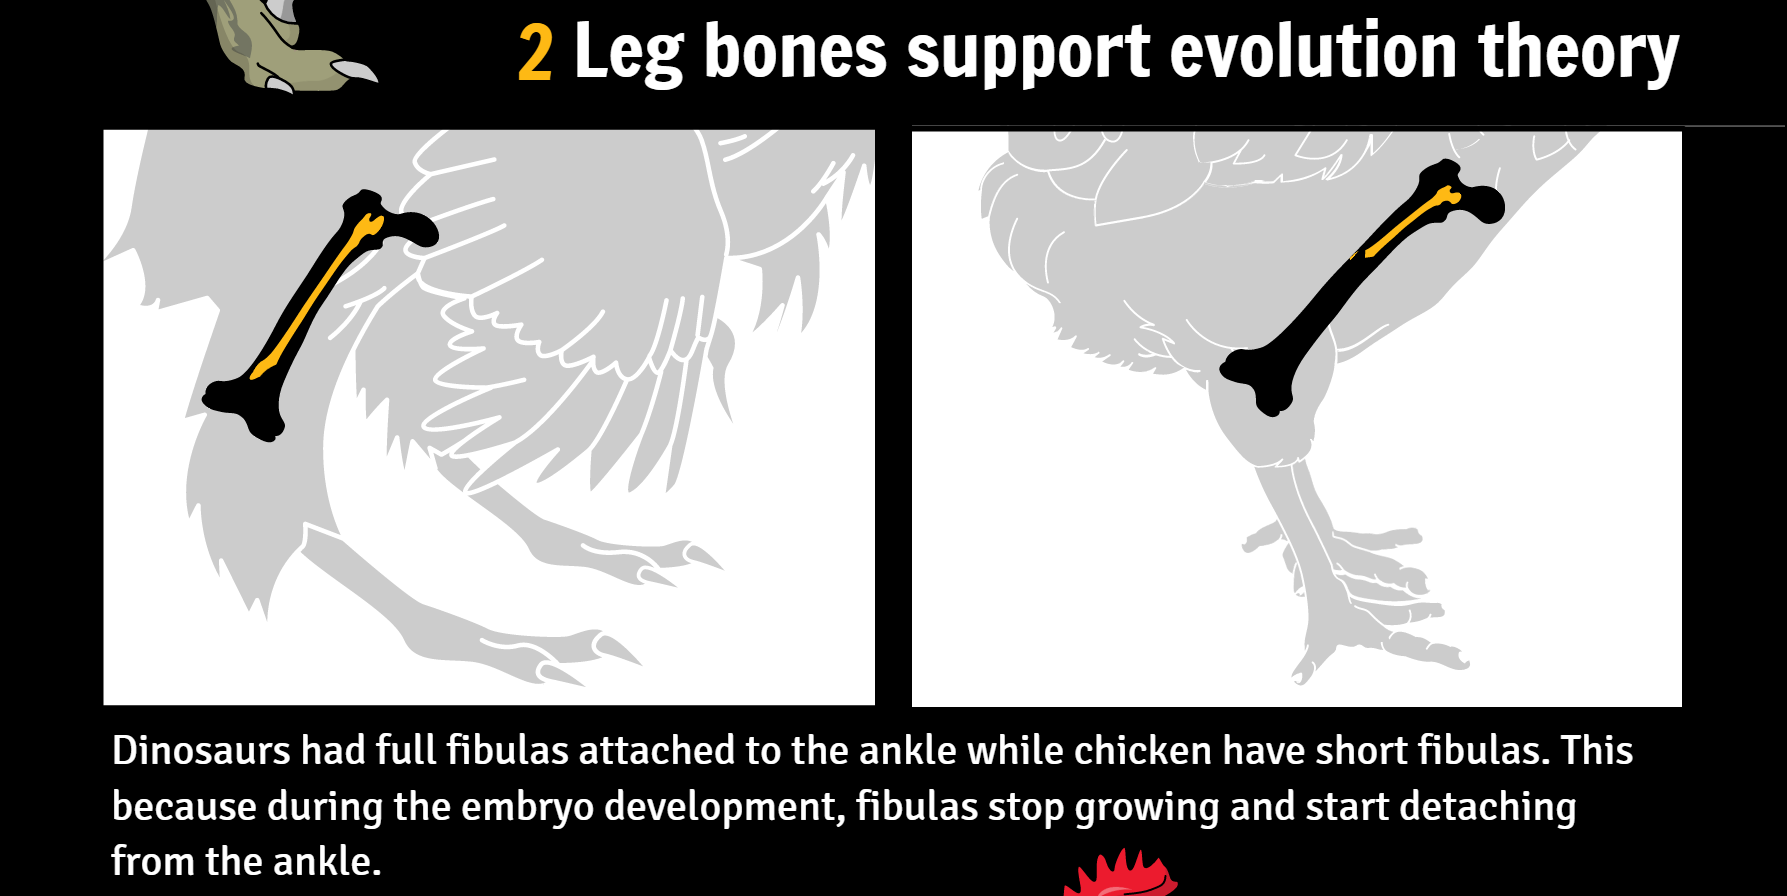
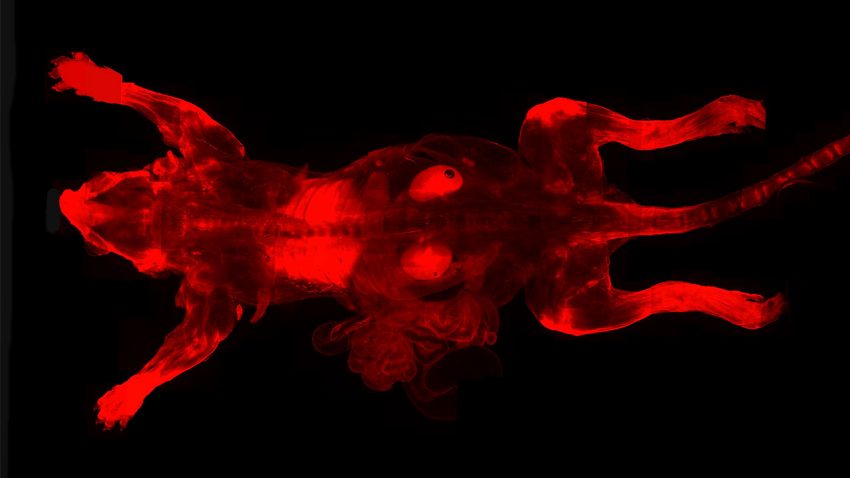
La semaine dernière, Botelho et al. ont publié une nouvelle recherche sur la manipulation génétique chez le poulet. Leur [...]
Les films de science-fiction nous ont donné l'espoir de développer des super-pouvoirs tels que l'invisibilité, la super-force [...].
Paris, France & San Diego, CA (27 octobre 2016) - AgileBio, un fournisseur mondial de premier plan [...]
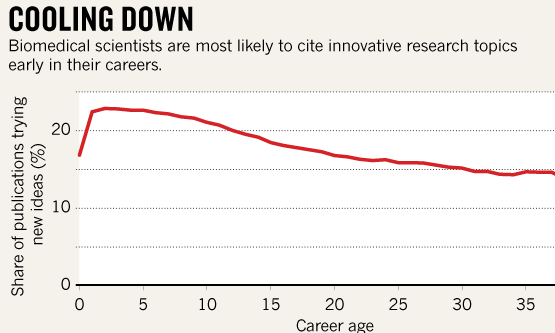
Isaac Newton 45 ans - Publication des Philosophiae Naturalis Principia Mathematica (Principes mathématiques de [...]
C'est toujours une fête lorsque nous voyons le travail extraordinaire de nos utilisateurs. J'ai déjà écrit sur [...]
Être un scientifique n'est pas une tâche facile. L'autonomie d'avoir son propre travail vient [...]
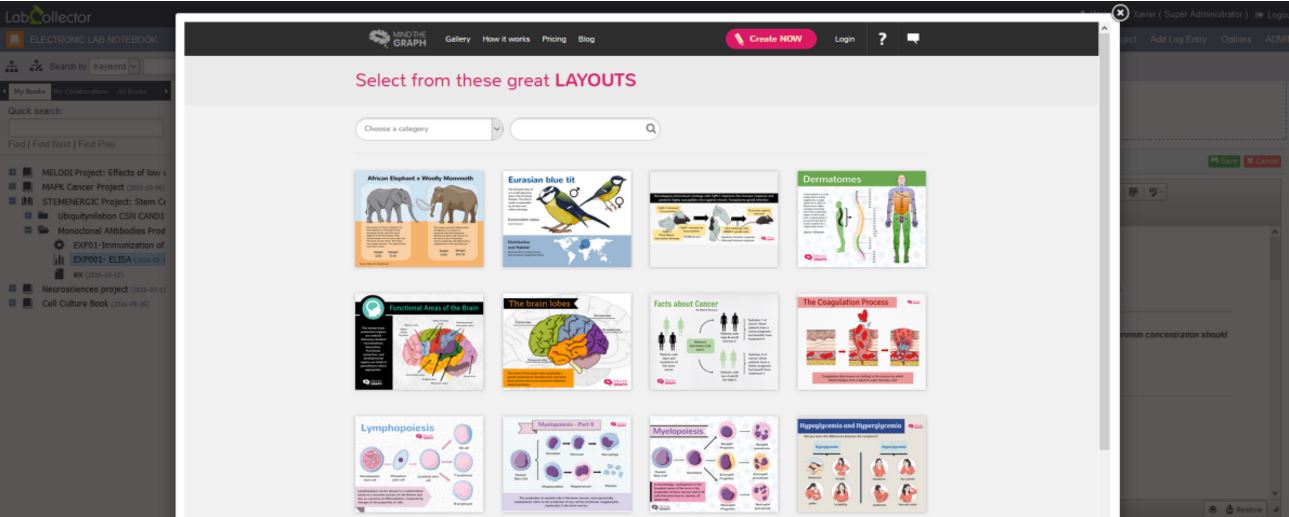
La première impression des utilisateurs de Mind the Graph lorsqu'ils se connectent à notre plateforme est : [...]
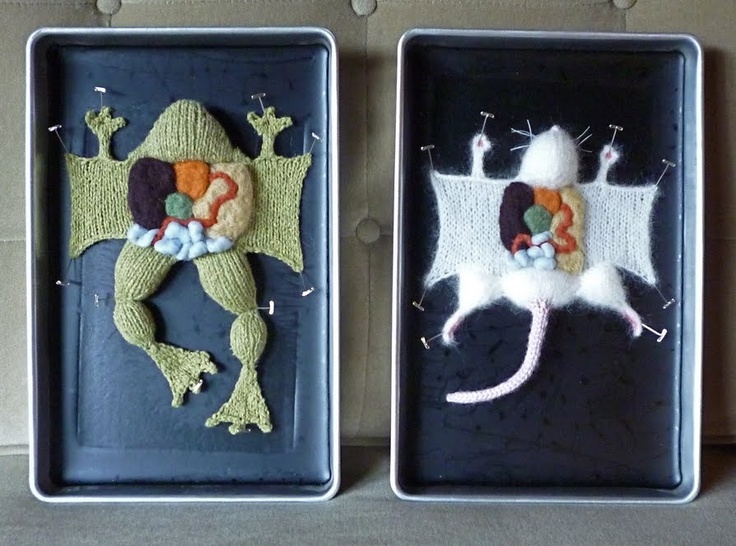
Lorsqu'il est question d'art scientifique, la plupart d'entre nous pensent immédiatement à des œuvres super réalistes et [...].
Post-docteur en sciences biologiques, Gabriela Trevisan est spécialisée dans la douleur et les processus inflammatoires. Ses [...]