4 min de lecture
09/20/2019
Le blog scientifique Mind The Graph a pour but d'aider les scientifiques à apprendre à communiquer la science d'une manière simple.
Oui. Le réchauffement climatique est réel. Du moins selon la science. C'est la réponse courte. Mais il est normal d'être confus quant au nom de réchauffement climatique. Surtout quand l'hiver arrive, qu'on a froid et qu'on s'attend à de la neige pour le week-end. Voyons donc les données scientifiques les plus récentes pour comprendre. 01. Climat X Météo Il [...]
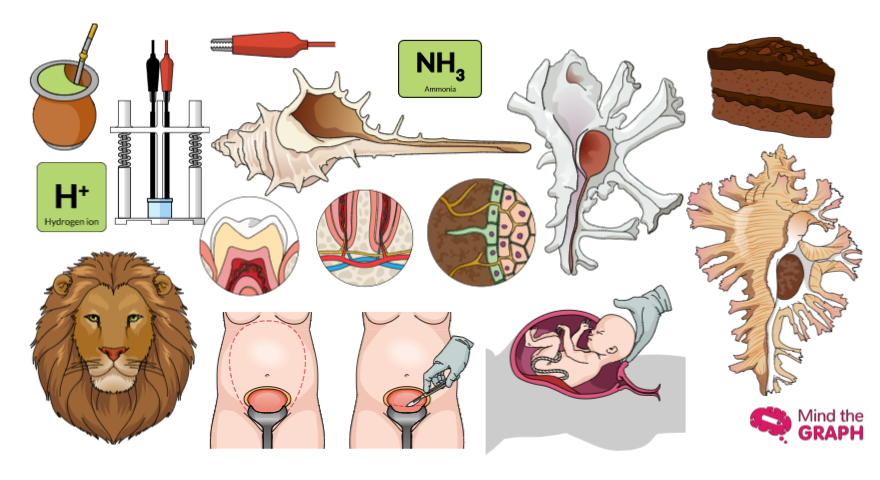
Bonjour à tous. Êtes-vous prêts à découvrir les meilleures illustrations scientifiques de la semaine ? Comme [...]
Les ressources visuelles sont puissantes pour mieux communiquer en sciences. Les illustrations scientifiques sont un bon exemple [...]
Comme vous le savez probablement déjà, nous disposons de la plus grande bibliothèque de [...].
Les derniers jours ont été difficiles, non ? Les feux de forêt dans la forêt amazonienne deviennent une tendance [...]
La rédaction d'un article scientifique est une étape très importante de la vie scientifique. Afin, vous devez [...]
Bonjour à tous ! Êtes-vous prêts à voir les nouvelles illustrations scientifiques ? Nous avons beaucoup [...]
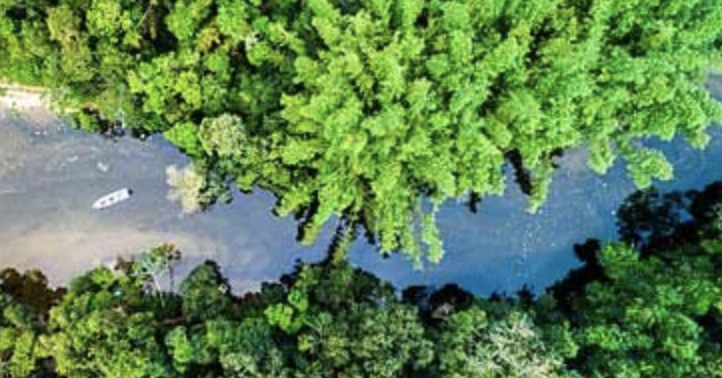
Nous pouvons nous rendre compte de l'immensité des forêts tropicales en regardant des photos de la cime des arbres prendre [...].
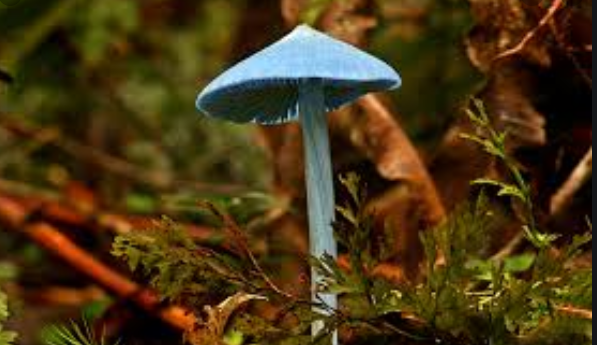
La forêt amazonienne est l'endroit le plus diversifié de la planète sur le plan biologique. De toutes les forêts connues [...]
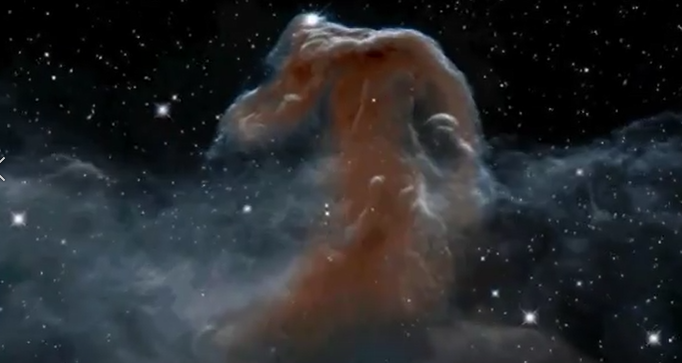
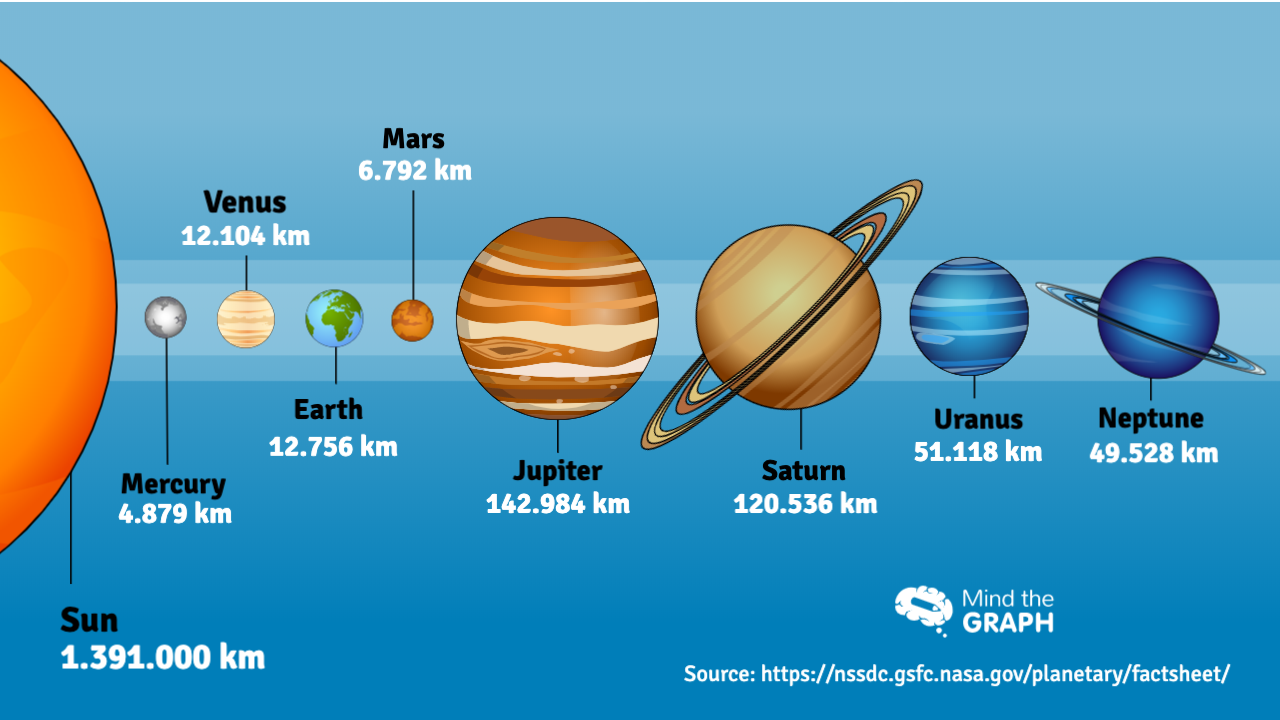
Quelle est la taille et la diversité de l'univers ? C'est une question difficile, même pour la physique. [...]
Embrassez-vous, le week-end arrive ! C'est de nouveau vendredi et nous attendons [...]
Bonjour à tous ! Nous avons de nouvelles illustrations scientifiques pour vous ! Tous les vendredis, nous vous montrons ce qui [...]
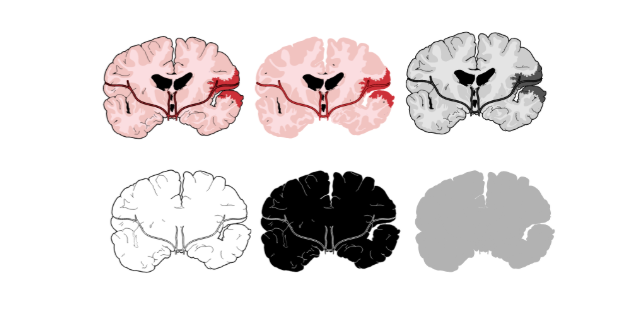
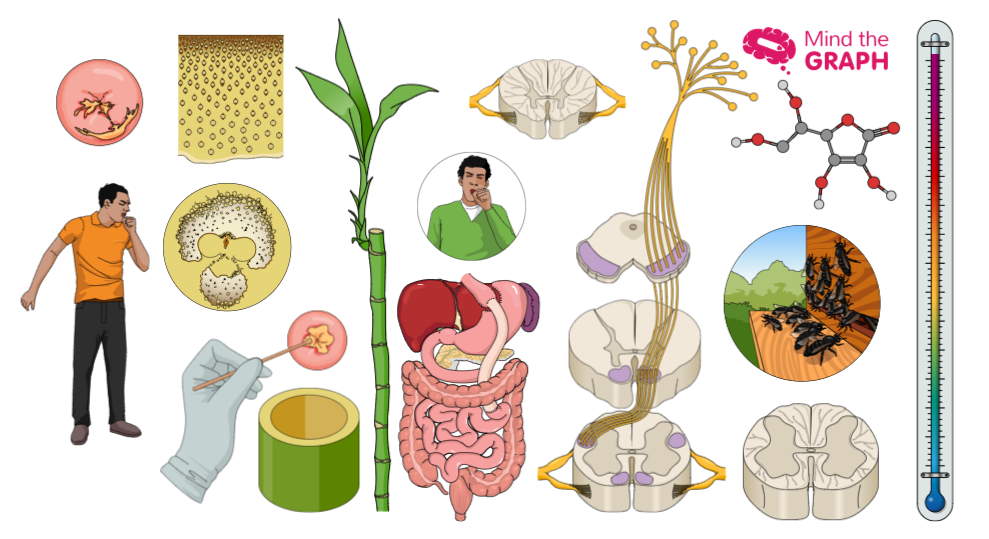
Ce billet traite d'un sujet très sérieux et important. Chaque année, près de 800 000 personnes [...]