10 min de lecture
12/28/2020
Le blog scientifique Mind The Graph a pour but d'aider les scientifiques à apprendre à communiquer la science d'une manière simple.
Les pandémies ont été le sujet de recherche le plus brûlant en 2020. L'impact de la pandémie de COVID-19 sur nos vies nous a tous poussés à explorer ce vaste sujet. Étudiants, chercheurs, professeurs, nombreux sont ceux qui ont entrepris des recherches sur les pandémies afin de présenter leurs précieuses découvertes et d'aider le monde d'une manière ou d'une autre. Est-ce que [...]
En novembre 2020, a été publié un article rapportant la synthèse d'un diamant nanocristallin et [...]
Pour comprendre le fonctionnement d'un neurone, il y a deux concepts que nous devons prendre [...].
Vous travaillez sur votre prochain grand poster de microbiologie ? Vous vous demandez comment ne pas le faire ressembler à [...]
Vous préparez votre prochaine grande présentation médicale ? Vous passez des nuits blanches à penser à la [...]
Les nanotubes de carbone (CNT) sont des allotropes de carbone en forme de nid d'abeille cylindrique avec un nanodiamètre. Il existe [...]
Si vous avez deux minutes pour parcourir un document de recherche, que feriez-vous [...].
La pandémie de COVID-19 n'est pas seulement le sujet du jour, elle est le sujet du monde et va [...]
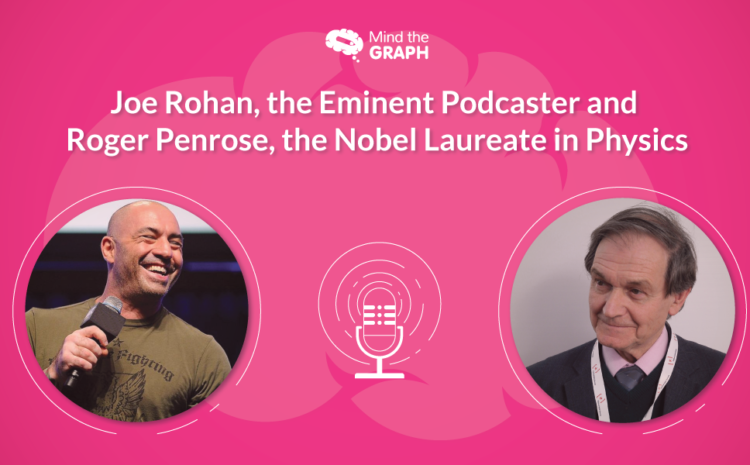
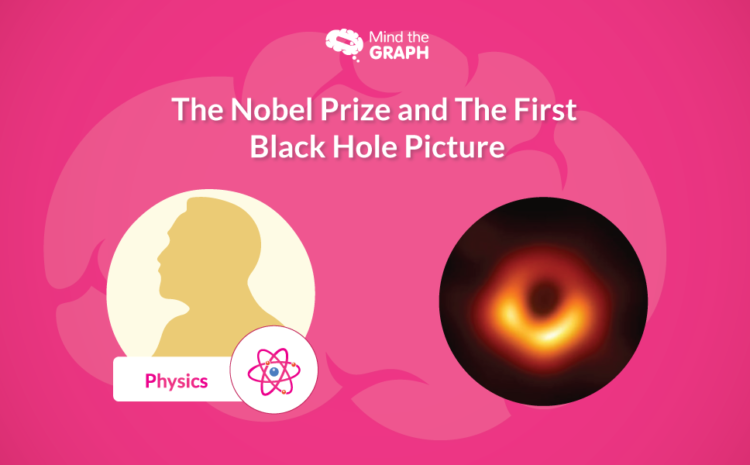
Si vous avez eu l'occasion de lire un autre article que j'ai écrit sur le prix Nobel [...].
Vous trouvez le courage de faire votre présentation, mais vous vous rendez compte que la plupart des [...].
Les histoires de réussite des clients sont toujours formidables. Cela nous donne, en tant que créateur d'infographies, une [...]
D'accord, d'accord, j'exagère peut-être un peu dans la photo ci-dessus - [...]