4 minutos de lectura
09/20/2019
El blog científico Mind The Graph pretende ayudar a los científicos a aprender a comunicar la ciencia de forma sencilla.
Sí. El calentamiento global es real. Al menos según la ciencia. Esta es la respuesta corta. Pero es normal confundirse con el nombre de calentamiento global. Especialmente cuando se acerca el invierno, se pasa frío y se espera que nieve el fin de semana. Así que veamos los datos científicos más recientes para entenderlo. 01. Clima X Tiempo Es [...]
Hola. ¿Estás preparado para ver las mejores ilustraciones científicas de la semana? Como [...]
Los recursos visuales son poderosos para comunicar mejor en la ciencia. Las ilustraciones científicas son un buen ejemplo [...]
Como probablemente sepa a estas alturas, tenemos la mayor biblioteca de [...]
Los últimos días han sido duros, ¿verdad? Los incendios forestales en la selva amazónica se convierten en una tendencia [...]
La creación de un artículo científico es un paso muy importante en la vida científica. Afinal, usted necesita [...]
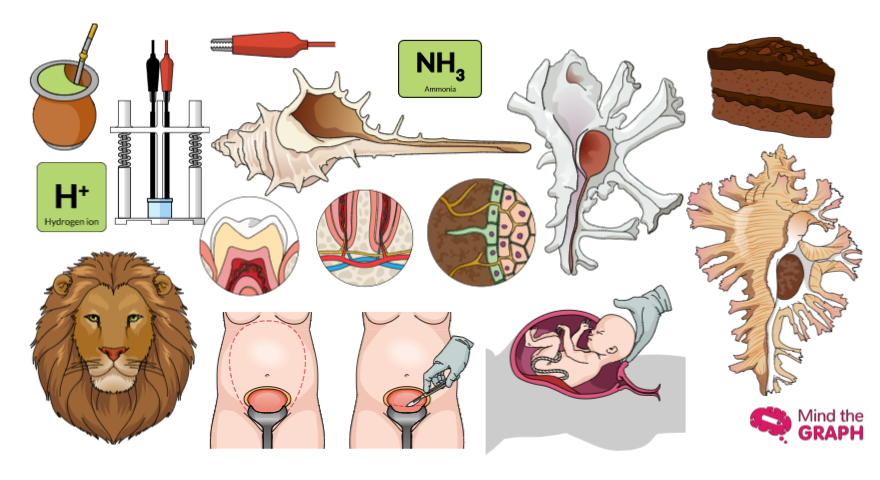
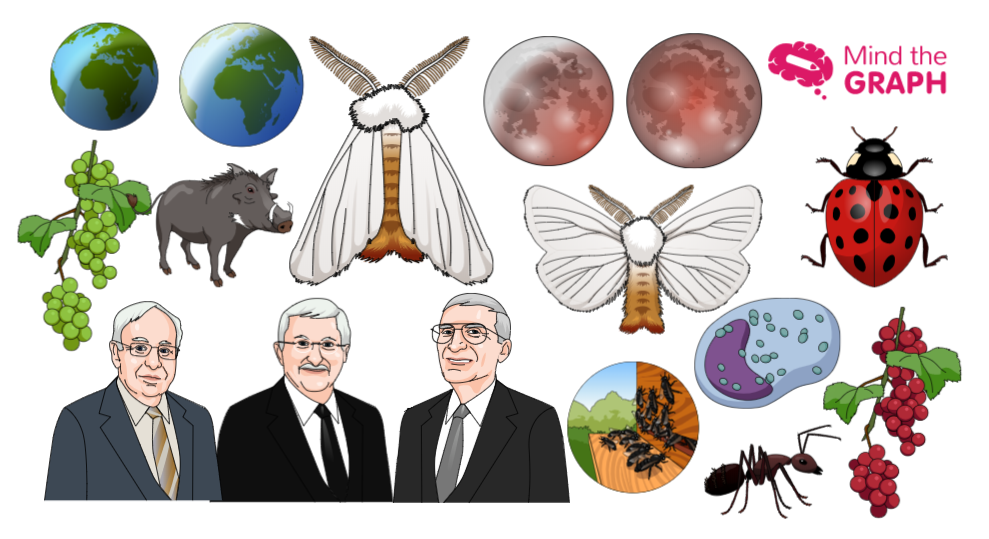
¡Hola a todos! ¿Estás preparado para ver las nuevas ilustraciones científicas? Tenemos un montón de [...]
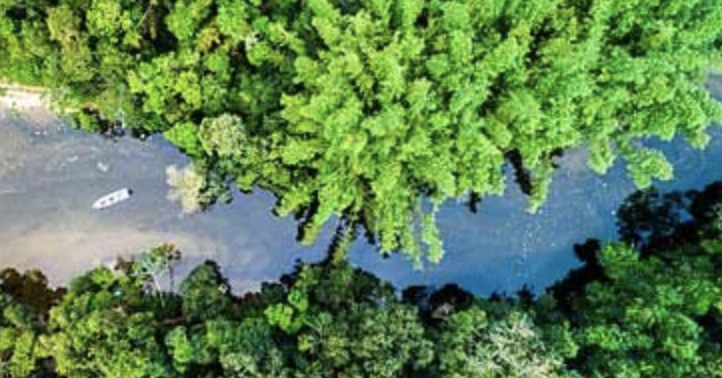
Podemos ver la inmensidad de las selvas tropicales mirando las fotos de las copas de los árboles tomar [...]
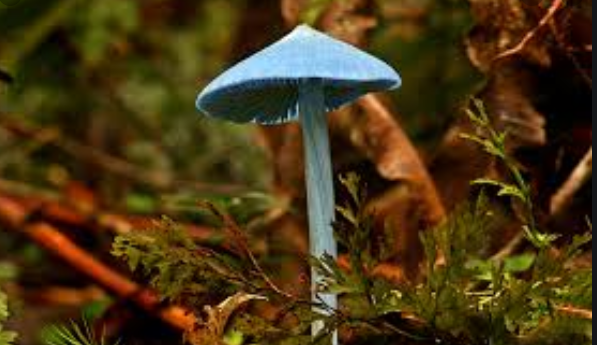
La selva amazónica es el lugar con mayor diversidad biológica de la Tierra. De todas las especies conocidas [...]
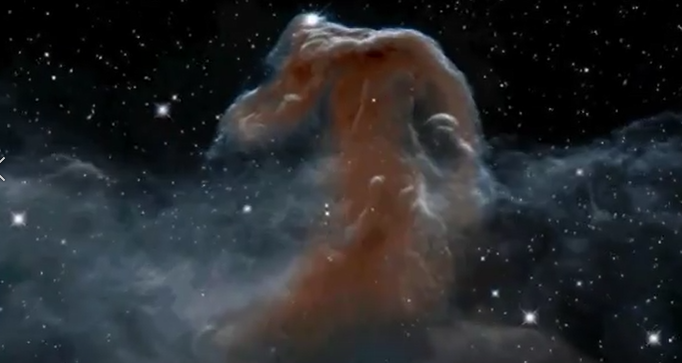
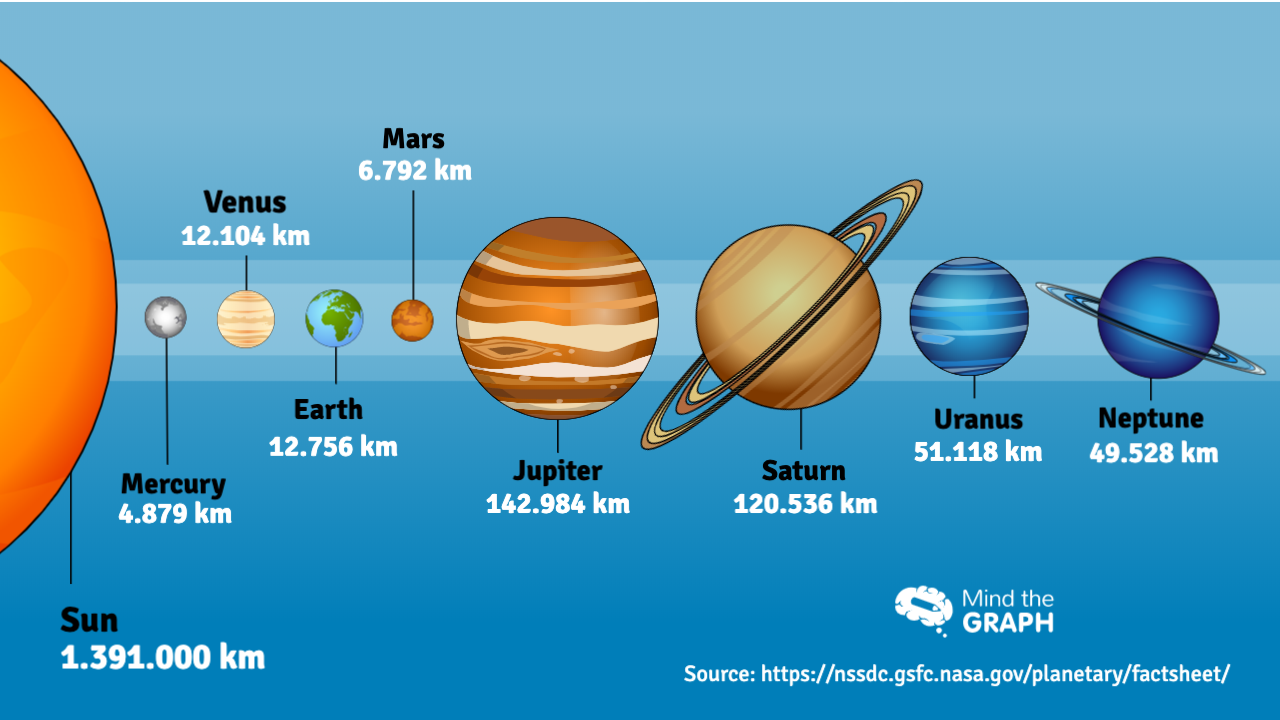
¿Cómo de grande y diverso es el universo? Bueno, esta es una pregunta difícil incluso para la física. [...]
Abrázate a ti mismo, ¡el fin de semana se acerca! Es viernes de nuevo y estamos esperando [...]
¡Hola a todos! ¡Tenemos nuevas ilustraciones científicas para ti! Todos los viernes mostramos lo que [...]
Este post trata de un tema muy serio e importante. Cada año, casi 800.000 personas [...]