2 minutos de lectura
04/08/2020
El blog científico Mind The Graph pretende ayudar a los científicos a aprender a comunicar la ciencia de forma sencilla.
Ya tengo una opinión, pero vamos a cubrir todas las teorías disponibles: 1) La más obvia: el sistema sanitario de Alemania está mejor equipado 2) Los alemanes están utilizando tratamientos innovadores 3) Alemania aún está en los primeros días del brote, por lo que no hubo "tiempo suficiente" para que la tasa de mortalidad se estabilizara Y [...]
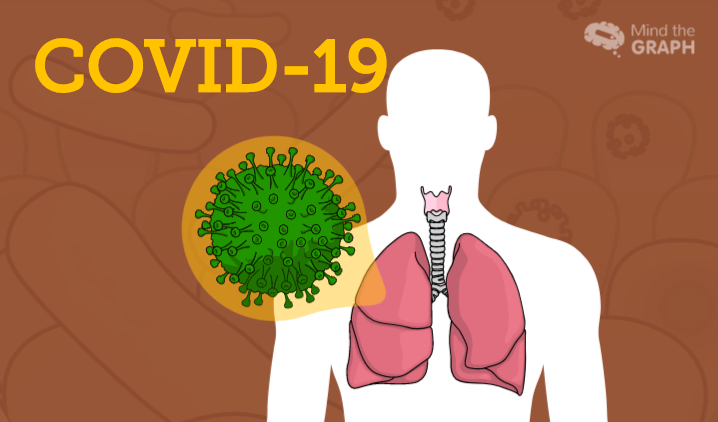
3) Desde el punto de vista celular, el mecanismo de infección del coronavirus reconoce los receptores ACE2 en el [...]
Como mencionamos en el primer post de esta serie sobre el coronavirus, el ritmo [...]
La historia de su descubrimiento es que Fleming había estado investigando las propiedades de los estafilococos. [...]
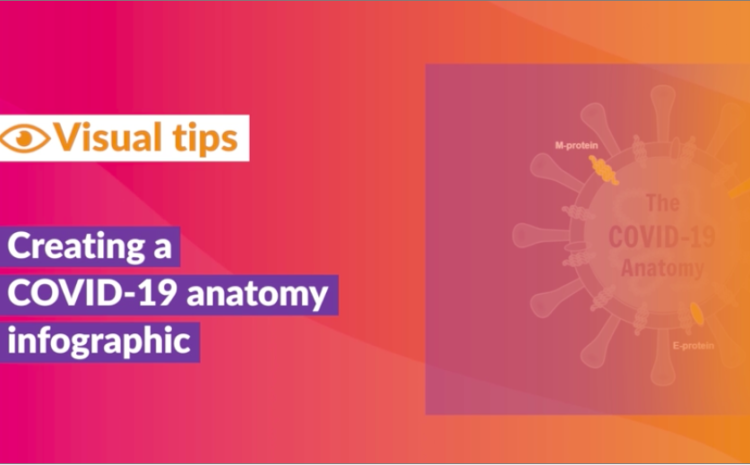
El mundo se enfrenta a una gran crisis sanitaria. En medio de la novedosa pandemia de Coronavirus, la primera [...]
Si necesita cifras científicas, este es el lugar, tenemos literalmente miles de [...]
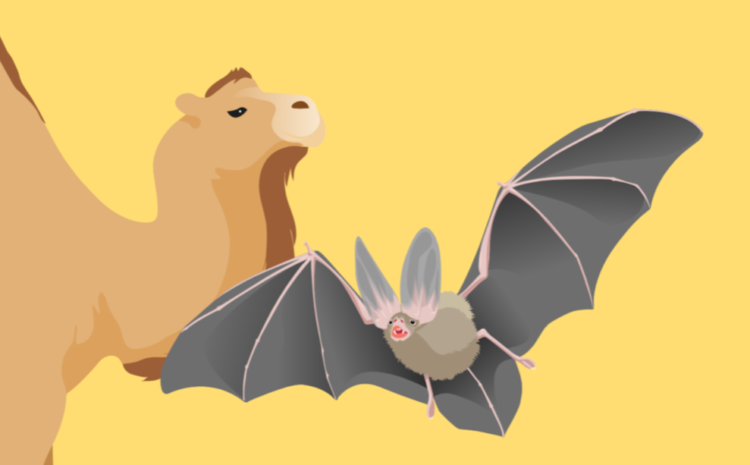
Esta es una pregunta intrigante. Si fueras un detective tratando de encontrar el coronavirus [...]
A pesar de que el número total de casos es exactamente el mismo, el aplanamiento [...]