Correlational research is a vital method for identifying and measuring relationships between variables in their natural settings, offering valuable insights for science and decision-making. This article explores correlational research, its methods, applications, and how it helps uncover patterns that drive scientific progress.
Correlational research differs from other forms of research, such as experimental research, in that it does not involve the manipulation of variables or establish causality, but it helps reveal patterns that can be useful for making predictions and generating hypotheses for further study. Examining the direction and strength of associations between variables, correlational research offers valuable insights in fields such as psychology, medicine, education, and business.
Unlocking the Potential of Correlational Research
As a cornerstone of non-experimental methods, correlational research examines relationships between variables without manipulation, emphasizing real-world insights. The primary goal is to determine if a relationship exists between variables and, if so, the strength and direction of that relationship. Researchers observe and measure these variables in their natural settings to assess how they relate to one another.
A researcher might investigate whether there is a correlation between hours of sleep and student academic performance. They would gather data on both variables (sleep and grades) and use statistical methods to see if a relationship exists between them, such as whether more sleep is associated with higher grades (a positive correlation), less sleep is associated with higher grades (a negative correlation), or if there is no significant relationship (zero correlation).
Exploring Variable Relationships with Correlational Research
Identify Relationships Between Variables: The primary goal of correlational research is to identify relationships between variables, quantify their strength, and determine their direction, paving the way for predictions and hypotheses. Identifying these relationships allows researchers to uncover patterns and associations that may take time to be obvious.
Make Predictions: Once relationships between variables are established, correlational research can help make informed predictions. For instance, if a positive correlation between academic performance and study time is observed, educators can predict that students who spend more time studying may perform better academically.

Generate Hypotheses for Further Research: Correlational studies often serve as a starting point for experimental research. Uncovering relationships between variables provides the foundation for generating hypotheses that can be tested in more controlled, cause-and-effect experiments.
Study Variables That Cannot Be Manipulated: Correlational research allows for the study of variables that cannot ethically or practically be manipulated. For example, a researcher may want to explore the relationship between socioeconomic status and health outcomes, but it would be unethical to manipulate someone’s income for research purposes. Correlational studies make it possible to examine these types of relationships in real-world settings.
Significance of Correlational Research in the Research World
Ethical Flexibility: Studying sensitive or complex issues where experimental manipulation is unethical or impractical becomes possible through correlational research. For example, exploring the relationship between smoking and lung disease cannot be ethically tested through experimentation but can be effectively examined using correlational methods.
Broad Applicability: This type of research is widely used across different disciplines, including psychology, education, health sciences, economics, and sociology. Its flexibility allows it to be applied in diverse settings, from understanding consumer behavior in marketing to exploring social trends in sociology.
Insight into Complex Variables: Correlational research enables the study of complex and interconnected variables, offering a broader understanding of how factors like lifestyle, education, genetics, or environmental conditions are related to certain outcomes. It provides a foundation for seeing how variables may influence one another in the real world.
Foundation for Further Research: Correlational studies often spark further scientific inquiry. While they cannot prove causality, they highlight relationships worth exploring. Researchers can use these studies to design more controlled experiments or delve into deeper qualitative research to better understand the mechanisms behind the observed relationships.
How Correlational Research Differs from Other Types of Research
No Manipulation of Variables
One key difference between correlational research and other types, such as experimental research, is that in correlational research, the variables are not manipulated. In experiments, the researcher introduces changes to one variable (independent variable) to see its effect on another (dependent variable), creating a cause-and-effect relationship. In contrast, correlational research only measures the variables as they naturally occur, without interference from the researcher.
Causality vs. Association
While experimental research aims to determine causality, correlational research does not. The focus is solely on whether variables are related, not whether one causes changes in the other. For example, if a study shows that there is a correlation between eating habits and physical fitness, it doesn’t mean that eating habits cause better fitness, or vice versa; both might be influenced by other factors such as lifestyle or genetics.
Direction and Strength of Relationships
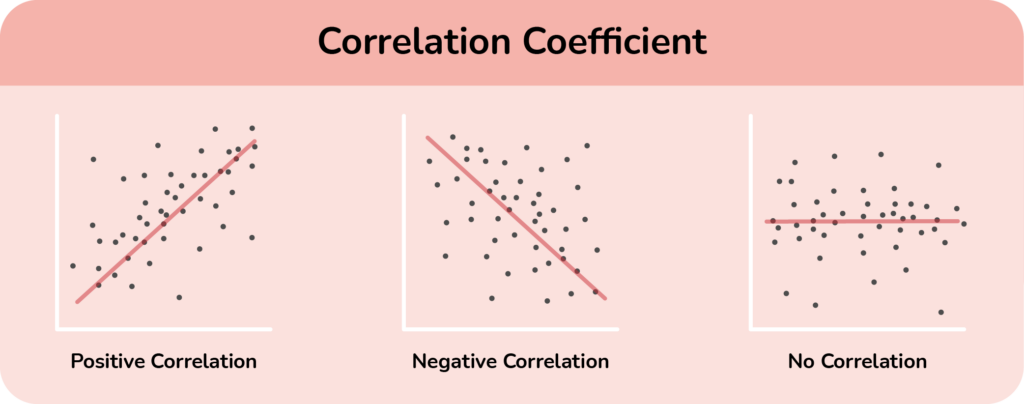
Correlational research is concerned with the direction (positive or negative) and strength of relationships between variables, which is different from experimental or descriptive research. The correlation coefficient quantifies this, with values ranging from -1 (perfect negative correlation) to +1 (perfect positive correlation). A correlation close to zero implies little to no relationship. Descriptive research, in contrast, focuses more on observing and describing characteristics without analyzing relationships between variables.
Flexibility in Variables
Unlike experimental research which often requires precise control over variables, correlational research allows for more flexibility. Researchers can examine variables that cannot be ethically or practically manipulated, such as intelligence, personality traits, socioeconomic status, or health conditions. This makes correlational studies ideal for examining real-world conditions where control is impossible or undesirable.
Exploratory Nature
Correlational research is often used in the early stages of research to identify potential relationships between variables that can be explored further in experimental designs. In contrast, experiments tend to be hypothesis-driven, focusing on testing specific cause-and-effect relationships.
Types of Correlational Research
Positive Correlation
A positive correlation occurs when an increase in one variable is associated with an increase in another variable. Essentially, both variables move in the same direction—if one goes up, so does the other, and if one goes down, the other decreases as well.
Examples of Positive Correlation:
Height and weight: In general, taller people tend to weigh more, so these two variables show a positive correlation.
Education and income: Higher levels of education are often correlated with higher earnings, so as education increases, income tends to increase as well.
Exercise and physical fitness: Regular exercise is positively correlated with improved physical fitness. The more frequently a person exercises, the more likely they are to have better physical health.
In these examples, the increase of one variable (height, education, exercise) leads to an increase in the related variable (weight, income, fitness).
Negative Correlation
A negative correlation occurs when an increase in one variable is associated with a decrease in another variable. Here, the variables move in opposite directions—when one rises, the other falls.
Examples of Negative Correlation:
Alcohol consumption and cognitive performance: Higher levels of alcohol consumption are negatively correlated with cognitive function. As alcohol intake increases, cognitive performance tends to decrease.
Time spent on social media and sleep quality: More time spent on social media is often negatively correlated with sleep quality. The longer people engage with social media, the less likely they are to get restful sleep.
Stress and mental well-being: Higher stress levels are often correlated with lower mental well-being. As stress increases, a person’s mental health and overall happiness may decrease.
In these scenarios, as one variable increases (alcohol consumption, social media use, stress), the other variable (cognitive performance, sleep quality, mental well-being) decreases.
Zero Correlation
A zero correlation means that there is no relationship between two variables. Changes in one variable have no predictable effect on the other. This indicates that the two variables are independent of one another and that there is no consistent pattern linking them.
Examples of Zero Correlation:
Shoe size and intelligence: There is no relationship between the size of a person’s shoes and their intelligence. The variables are entirely unrelated.
Height and musical ability: Someone’s height has no bearing on how well they can play a musical instrument. There is no correlation between these variables.
Rainfall and exam scores: The amount of rainfall on a particular day has no correlation with the exam scores students achieve in school.
In these cases, the variables (shoe size, height, rainfall) do not impact the other variables (intelligence, musical ability, exam scores), indicating a zero correlation.
Methods of Conducting Correlational Research
Correlational research can be conducted using various methods, each offering unique ways to collect and analyze data. Two of the most common approaches are surveys and questionnaires and observational studies. Both methods allow researchers to gather information on naturally occurring variables, helping to identify patterns or relationships between them.
Surveys and Questionnaires
How They Are Used in Correlational Studies:
Surveys and questionnaires gather self-reported data from participants about their behaviors, experiences, or opinions. Researchers use these tools to measure multiple variables and identify potential correlations. For example, a survey might examine the relationship between exercise frequency and stress levels.
Benefits:
Efficiency: Surveys and questionnaires enable researchers to gather large amounts of data quickly, making them ideal for studies with big sample sizes. This speed is especially valuable when time or resources are limited.
Standardization: Surveys ensure that every participant is presented with the same set of questions, reducing variability in how data is collected. This enhances the reliability of the results and makes it easier to compare responses across a large group.
Cost-effectiveness: Administering surveys, particularly online, is relatively inexpensive compared to other research methods like in-depth interviews or experiments. Researchers can reach wide audiences without significant financial investment.
Limitations:
Self-report bias: Since surveys rely on participants’ self-reported information, there’s always a risk that responses may not be entirely truthful or accurate. People might exaggerate, underreport, or provide answers they think are socially acceptable, which can skew the results.
Limited depth: While surveys are efficient, they often capture only surface-level information. They can show that a relationship exists between variables but may not explain why or how this relationship occurs. Open-ended questions can offer more depth but are harder to analyze on a large scale.
Response rates: A low response rate can be a major issue, as it reduces the representativeness of the data. If those who respond differ significantly from those who don’t, the results may not accurately reflect the broader population, limiting the generalizability of the findings.
Observational Studies
Process of Observational Studies:
In observational studies, researchers observe and record behaviors in natural settings without manipulating variables. This method helps assess correlations, such as observing classroom behavior to explore the relationship between attention span and academic engagement.
Effectiveness:
- Best for studying natural behaviors in real-world settings.
- Ideal for ethically sensitive topics where manipulation isn’t feasible.
- Effective for longitudinal studies to observe changes over time.
Benefits:
- Provides real-world insights and higher ecological validity.
- Avoids self-report bias since behaviors are directly observed.
Limitations:
- Risk of observer bias or influencing participant behavior.
- Time-consuming and resource-intensive.
- Limited control over variables, making it hard to establish specific causal relationships.
Analyzing Correlational Data
Statistical Techniques
Several statistical techniques are commonly used to analyze correlational data, allowing researchers to quantify the relationships between variables.
Correlation Coefficient:
The correlation coefficient is a key tool in correlation analysis. It is a numerical value that ranges from -1 to +1, indicating both the strength and direction of the relationship between two variables. The most widely used correlation coefficient is Pearson’s correlation, which is ideal for continuous, linear relationships between variables.
+1 indicates a perfect positive correlation, where both variables increase together.
-1 indicates a perfect negative correlation, where one variable increases as the other decreases.
0 indicates no correlation, meaning there is no observable relationship between the variables.
Other correlation coefficients include Spearman’s rank correlation (used for ordinal or non-linear data) and Kendall’s tau (used for ranking data with fewer assumptions about the data distribution).
Scatter Plots:
Scatter plots visually represent the relationship between two variables, with each point corresponding to a pair of data values. Patterns within the plot can indicate positive, negative, or zero correlations. To explore scatter plots further, visit: What is a Scatter Plot?
Regression Analysis:
While primarily used for predicting outcomes, regression analysis aids in correlational studies by examining how one variable may predict another, providing a deeper understanding of their relationship without implying causation. For a comprehensive overview, check out this resource: A Refresher on Regression Analysis.
Interpreting Results
The correlation coefficient is central to interpreting results. Depending on its value, researchers can classify the relationship between variables:
Strong positive correlation (+0.7 to +1.0): As one variable increases, the other also increases significantly.
Weak positive correlation (+0.1 to +0.3): A slight upward trend indicates a weak relationship.
Strong negative correlation (-0.7 to -1.0): As one variable increases, the other decreases significantly.
Weak negative correlation (-0.1 to -0.3): A slight downward trend, where one variable slightly decreases as the other increases.
Zero correlation (0): No relationship exists; the variables move independently.
Caution Against Assuming Causation:
One of the most crucial points when interpreting correlational results is avoiding the assumption that correlation implies causation. Just because two variables are correlated does not mean one causes the other. There are several reasons for this caution:
Third-Variable Problem:
A third, unmeasured variable may be influencing both correlated variables. For example, a study might show a correlation between ice cream sales and drowning incidents. However, the third variable—temperature—explains this relationship; hot weather increases both ice cream consumption and swimming, which could lead to more drownings.
Directionality Problem:
Correlation does not indicate the direction of the relationship. Even if a strong correlation is found between variables, it’s not clear whether variable A causes B, or B causes A. For example, if researchers find a correlation between stress and illness, it could mean stress causes illness, or that being ill leads to higher stress levels.
Coincidental Correlation:
Sometimes, two variables may be correlated purely by chance. This is known as a spurious correlation. For example, there might be a correlation between the number of movies Nicolas Cage appears in during a year and the number of drownings in swimming pools. This relationship is coincidental and not meaningful.
Real-World Applications of Correlational Research
In Psychology
Correlational research is used to explore relationships between behaviors, emotions, and mental health. Examples include studies on the link between stress and health, personality traits and life satisfaction, and sleep quality and cognitive function. These studies help psychologists predict behavior, identify risk factors for mental health issues, and inform therapy and intervention strategies.
In Business
Businesses leverage correlational research to gain insights into consumer behavior, enhance employee productivity, and refine marketing strategies. For instance, they may analyze the relationship between customer satisfaction and brand loyalty, employee engagement and productivity, or advertising expenditure and sales growth. This research supports informed decision-making, resource optimization, and effective risk management.
In marketing, correlational research helps identify patterns between customer demographics and buying habits, enabling targeted campaigns that improve customer engagement.
Challenges and Limitations
Misinterpretation of Data
A significant challenge in correlational research is the misinterpretation of data, particularly the false assumption that correlation implies causation. For instance, a correlation between smartphone use and poor academic performance might lead to the incorrect conclusion that one causes the other. Common pitfalls include spurious correlations and overgeneralization. To avoid misinterpretations, researchers should use careful language, control for third variables, and validate findings across different contexts.
Ethical Considerations
Ethical concerns in correlational research include obtaining informed consent, maintaining participant privacy, and avoiding bias that could lead to harm. Researchers must ensure participants are aware of the study’s purpose and how their data will be used, and they must protect personal information. Best practices involve transparency, robust data protection protocols, and ethical review by an ethics board, particularly when working with sensitive topics or vulnerable populations.
Are You Looking For Figures To Communicate Science?
Mind the Graph is a valuable platform that aids scientists in effectively communicating their research through visually appealing figures. Recognizing the importance of visuals in conveying complex scientific concepts, it offers an intuitive interface with a diverse library of templates and icons for creating high-quality graphics, infographics, and presentations. This customization simplifies the communication of intricate data, enhances clarity, and broadens accessibility to diverse audiences, including those outside the scientific community. Ultimately, Mind the Graph empowers researchers to present their work in a compelling manner that resonates with stakeholders, from fellow scientists to policymakers and the general public. Visit our website for more information.

Subscribe to our newsletter
Exclusive high quality content about effective visual
communication in science.