Many scientific journals are asking for graphical abstracts to publish articles. A graphical or pic abstract (as a picture is worth a thousand words) helps the reader to understand the main information at first glance.
Different journals have different rules for the graphical abstract and this can make the publication process even harder. So, to help you in this process, we’ve made a tutorial on how to make a graphical abstract for Elsevier.
Graphical Abstract For Elsevier
A summary of what is expected of a graphical abstract:
“A Graphical Abstract should allow readers to quickly gain an understanding of the main take-home message of the paper and is intended to encourage browsing, promote interdisciplinary scholarship, and help readers identify more quickly which papers are most relevant to their research interests. Authors must provide an image that clearly represents the work described in the paper. A key figure from the original paper, summarizing the content can also be submitted as a graphical abstract.”
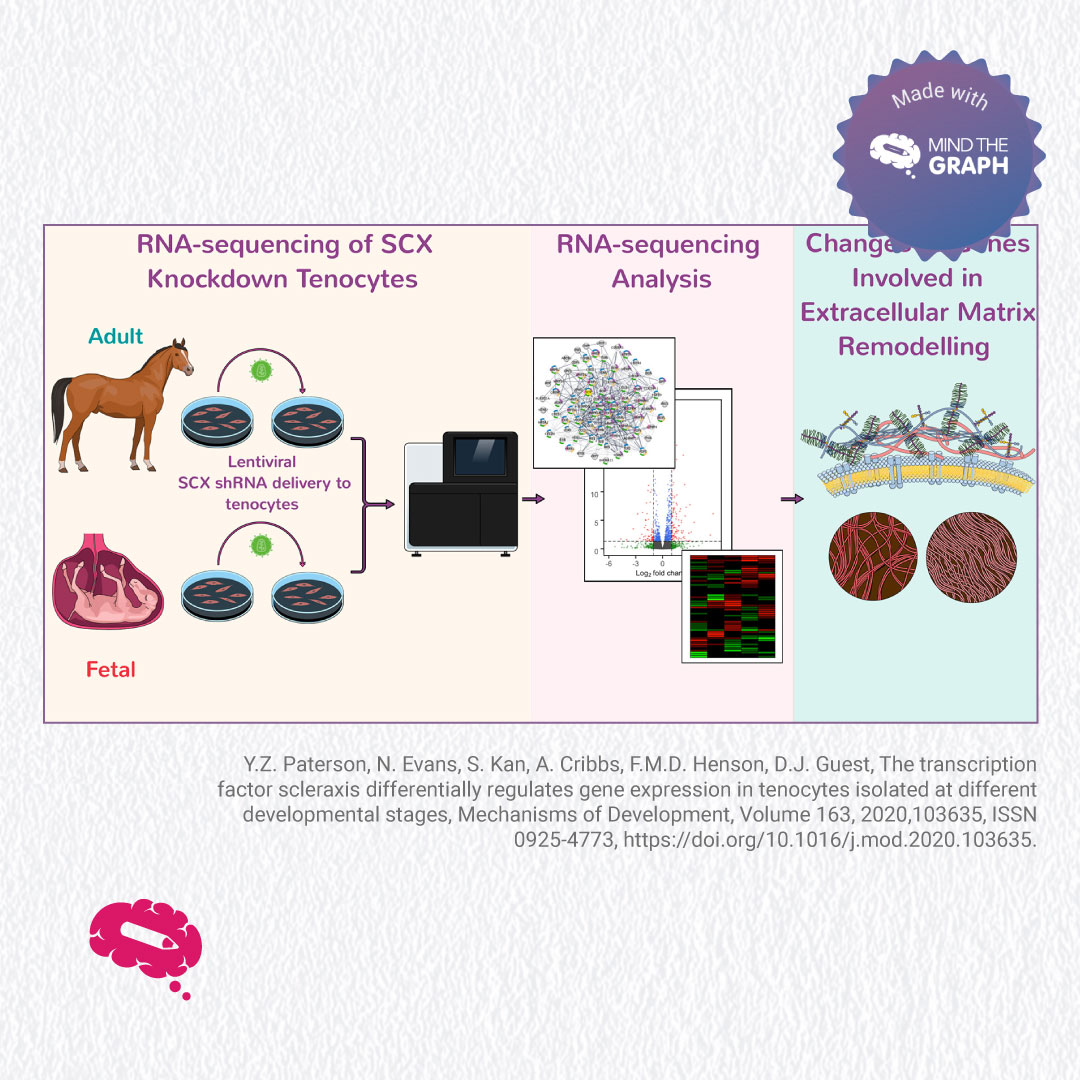
Reference: Y.Z. Paterson, N. Evans, S. Kan, A. Cribbs, F.M.D. Henson, D.J. Guest, The transcription factor scleraxis differentially regulates gene expression in tenocytes isolated at different developmental stages, Mechanisms of Development, Volume 163, 2020,103635, ISSN 0925-4773, https://doi.org/10.1016/j.mod.2020.103635.
What Is An Abstract?
Before that, it’s a good idea to quickly understand what an abstract is. An abstract is essentially a short summary of your research paper, usually a paragraph or two, around 250 words long.
It should crisply describe the problem, methodology, key findings, and conclusions.
A well-written abstract allows readers to get the gist of your paper quickly and prepares them to follow the detailed information, analyses, and arguments in your full paper.
It should be exact in wording, understandable to a wide audience, and serve as a hook for your audience.
There’s often a strict word limit, so make sure to check the requirements of the journal. That being said, here’s an under-300-word abstract sample from a study in the field of medicinal sciences:
“The Southwest shrub Juniperus communis (Juniper Berry) has many significant medicinal values in the Native American culture that has not been proven scientifically. One of the popular uses of Juniper berries aside from their detoxifying action is their potential to repel insects. This study focuses on the development of insect repellant from its essential oil obtained through steam distillation. 50 g of fresh berries were collected and dried for 5 days and is placed in a still tank with 100 mL of water for steam distillation using the Flinn Scientific Borosilicate Lab Kit. Gather the extracted oil and dilute 70% in three separate containers to be transferred into spray bottles. Testing involved the spraying of the dilute sample into a glass jar with Anopheles juidthae (common NM mosquito) and compared this to the effect of a commercial insect repellant. After testing and comparing the result, the commercial insect repellant significantly showed that it is a better insect repellant compared to the J. communis diluted essential oil. However, the essential oil has also an insect repellant potential.”
With the abstract text example understood, let’s dive into how to create a graphical abstract… (see examples below and a few templates on our website).
Creating A Graphical Abstract Using Mind The Graph
On our platform, you will find all the necessary tools to create your graphical abstract. In this video you can see step-by-step how to create your own graphical abstract for Elsevier:
Instructions To Create A Graphical Abstract For Elsevier
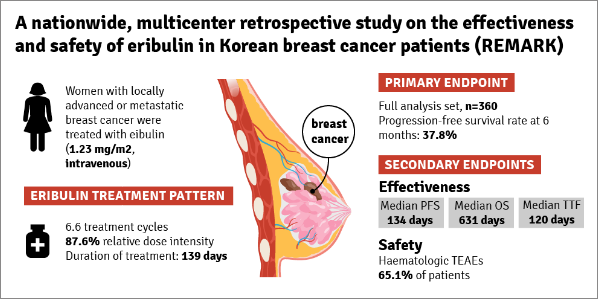
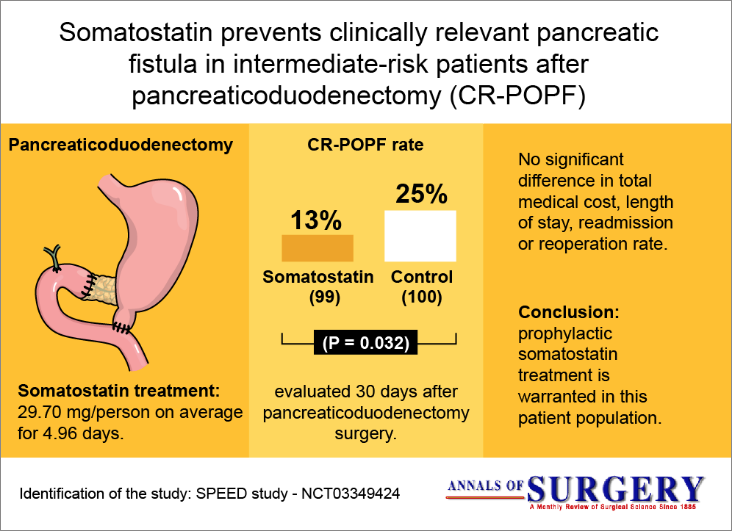
A graphical abstract should be a one-image file to help visualize a single process clearly and descriptively. For ease of consumption, the graphical abstract should have a clear start and end, preferably “reading” from top to bottom or left to right. Try to minimize distraction and remove cluttering elements as much as possible. Here are a few examples of graphical abstracts to aid your understanding.
Image size: Provide an image with a minimum of 531 x 1328 pixels (HxW) using a minimum resolution of 300 dpi. If you are submitting a larger image then please use the same ratio (200 high x 500 wide). Please note that your image will be scaled proportionally to fit in the available window on ScienceDirect; a 500 by 200-pixel rectangle.
Font: Please use Times, Arial, Courier, or Symbol font with a large enough font size as the image will be reduced in size for the Table of Contents to fit a window of 200 pixels high.
File type: preferred file types are TIFF, EPS, PDF, or MS Office files.
No additional text, outline, or synopsis should be included. Any text or label must be part of the image file. Please do not use unnecessary white space or the heading “Graphical Abstract” within the image file.
Create your Graphical Abstract for Elsevier with Mind the Graph
Enhance your research presentation by creating a stunning graphical abstract for Elsevier with Mind the Graph. This user-friendly tool allows you to design professional and visually appealing abstracts with ease. Whether you are an experienced researcher or new to scientific publishing, Mind the Graph provides a simple and efficient way to convert your data into captivating visuals. With no design skills required, you can focus on your research while ensuring your work stands out in academic journals. Try Mind the Graph today and take your research to the next level.


Subscribe to our newsletter
Exclusive high quality content about effective visual
communication in science.