days
hours
minutes
seconds
Mind The Graph Scientific Blog is meant to help scientists learn how to communicate science in an uncomplicated way.
Over the past few years, AI tools for researchers have become crucial, simplifying everything from literature discovery to manuscript writing and manuscript editing. The challenge lies in choosing the best AI tools for research that align with specific scholarly needs. Some focus on improving clarity and grammar, others on fact-checking and citation accuracy, while a few […]
Thousands of new papers appear daily across disciplines, each competing for a few seconds of […]
As AI becomes increasingly embedded in research and scholarly workflows, trust, transparency, and strong governance […]
Whether you’re preparing a manuscript, designing a conference poster, or sharing results on social platforms, the clarity […]
Report writing involves creating documents to communicate with readers about specific topics and to present facts, findings, and […]
Scientific illustration has become a cornerstone of modern research communication. Clear, well-designed visuals help researchers […]
Data visualization is the graphical representation of data and is used for understanding and communication, […]
Completing a thesis is a major milestone, but turning it into a publishable research paper […]
AI has quietly become a co-author in modern research. From grammar checks to literature reviews, […]
Choosing the right color palette is one of the most important steps in creating clear, […]
AI tools have revolutionized the way researchers work, making academic writing and scientific communication more […]
In a world where attention spans are shrinking, visual learning is no longer a “nice-to-have” […]
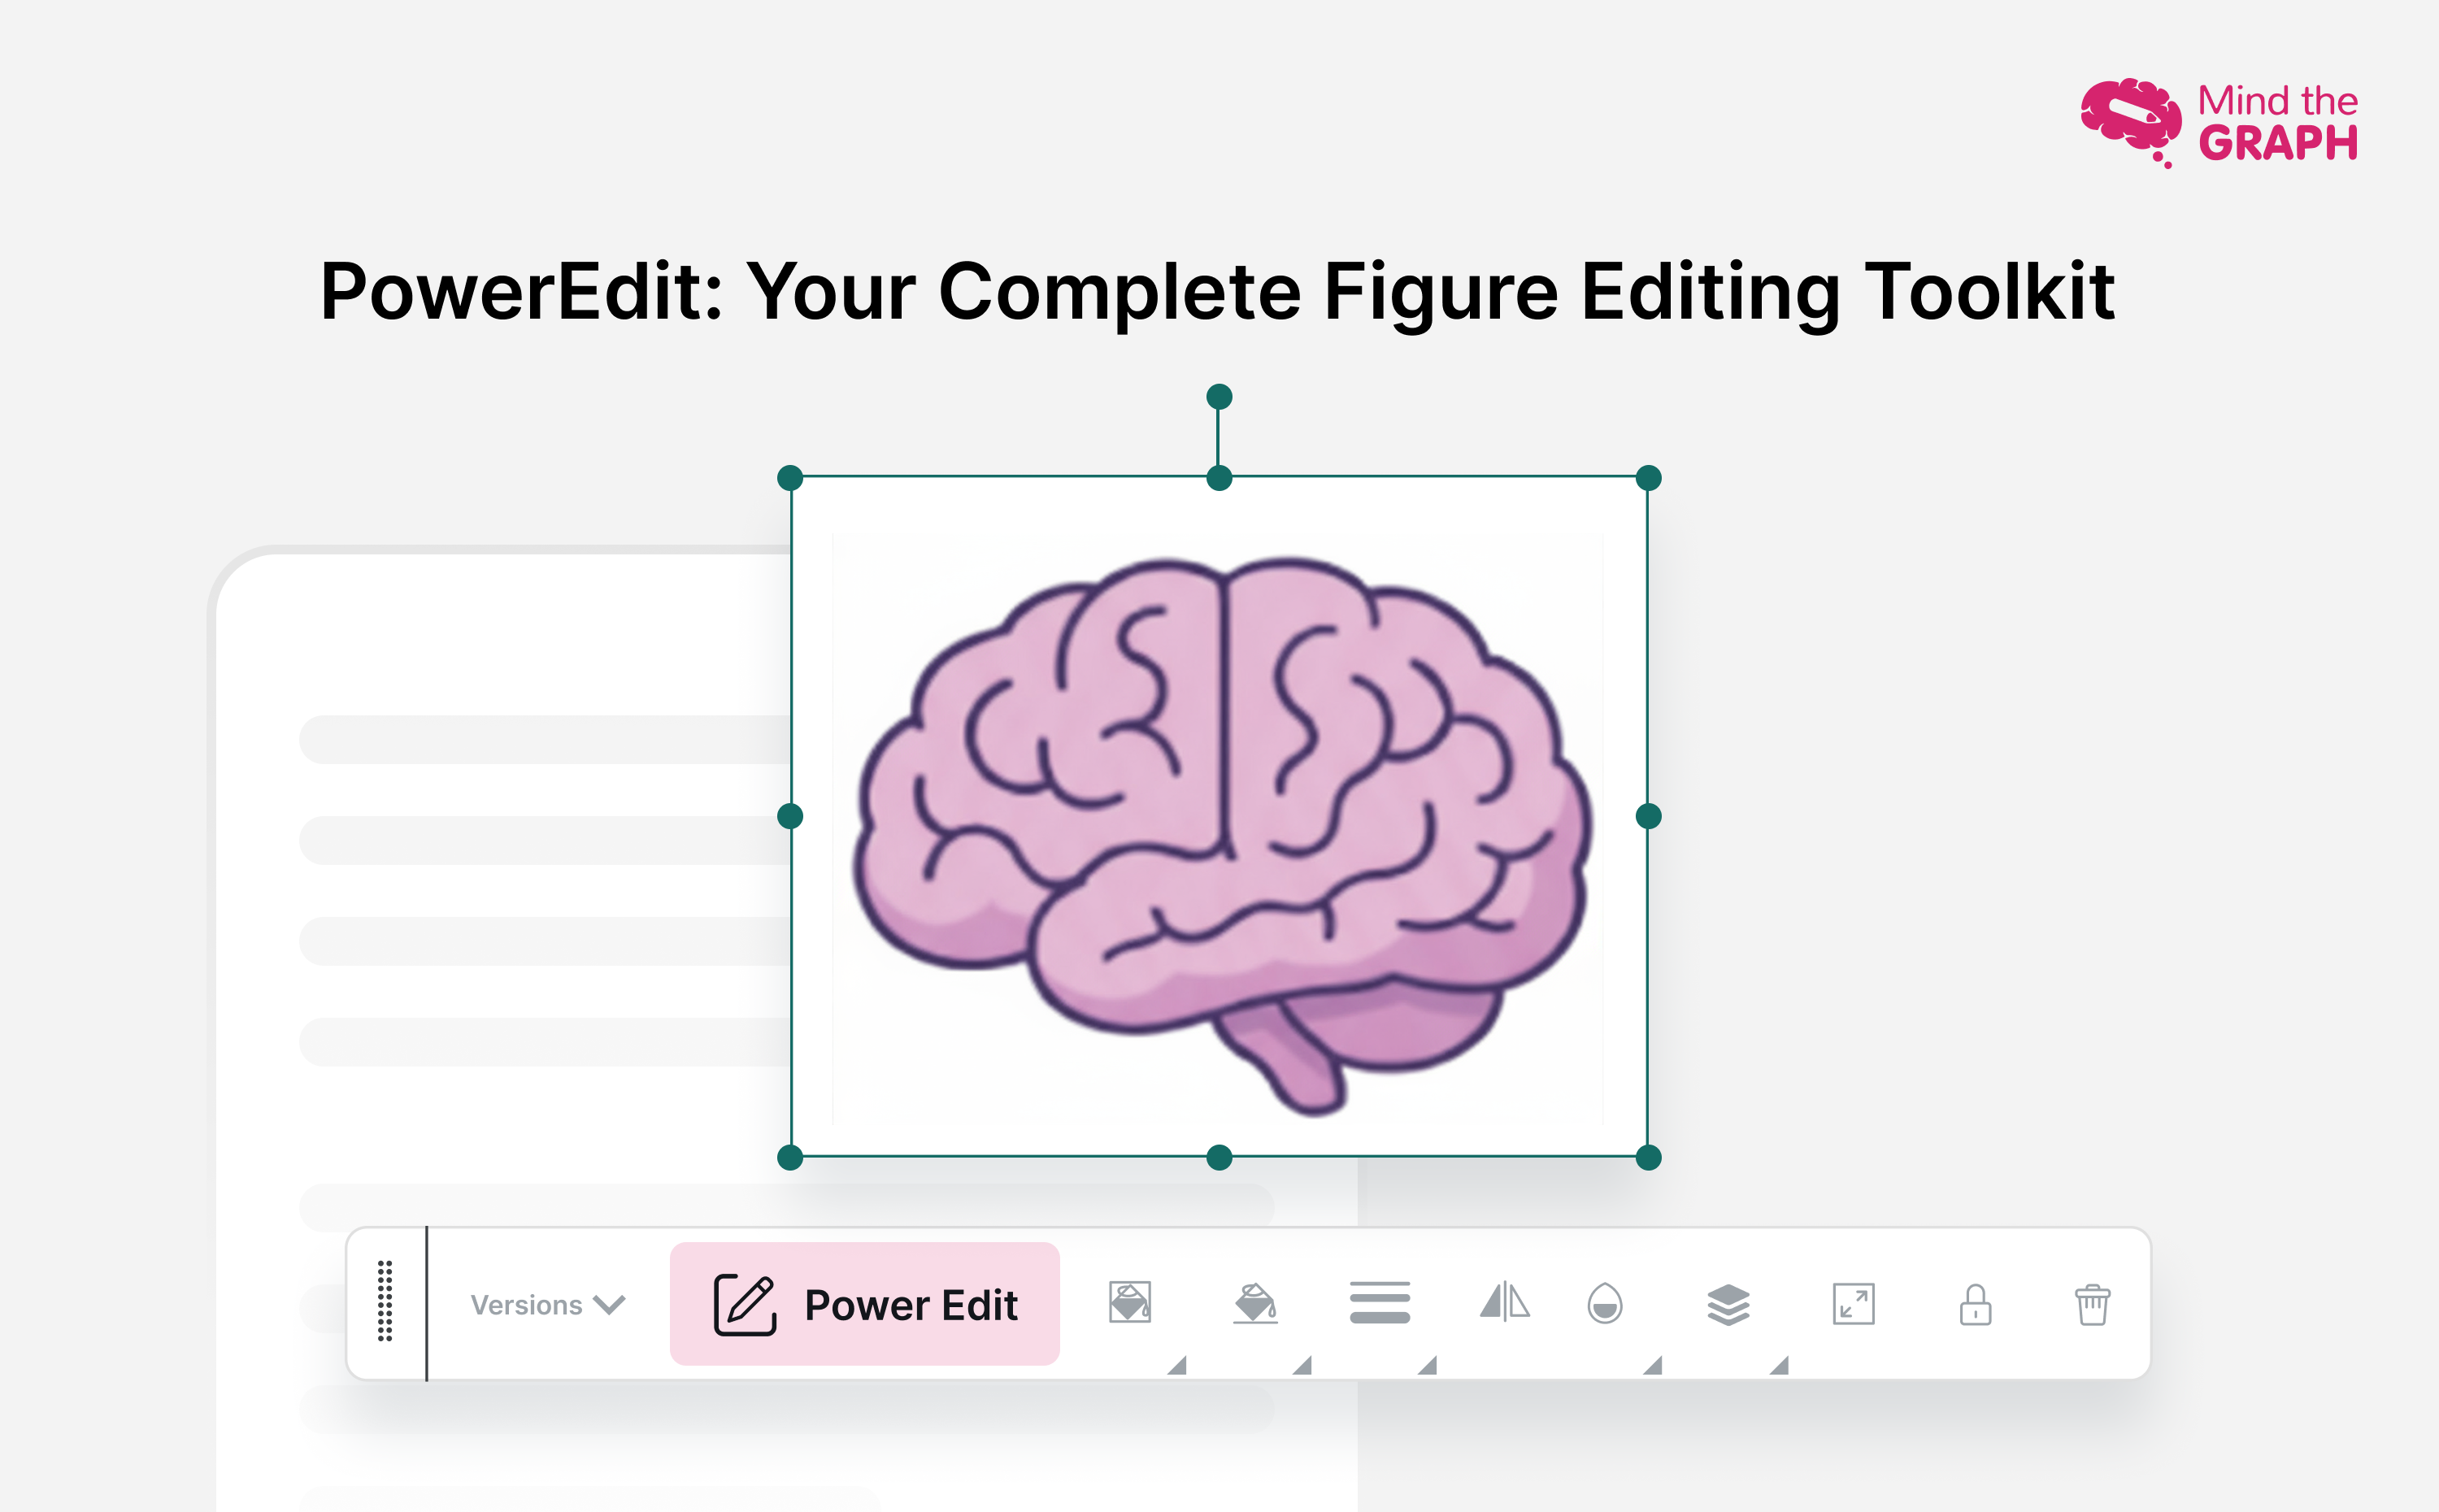
Great academics know that powerful visuals can transform research—but not all tools give you that […]