Mind the Graph Blog
  • Infographic maker
  • How it works
  • Tutorials
  • Portfolio
Mind the Graph Blog

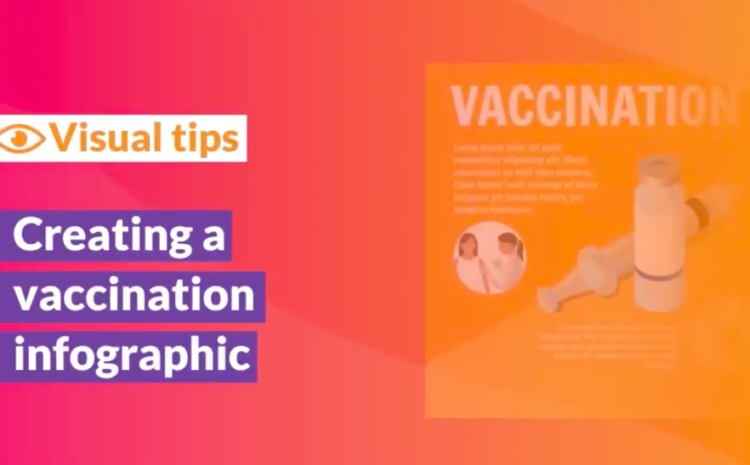
Tutorial video: creating a vaccination infographic template

Fabricio Pamplona Infographic, Tutorials April 15, 2020
Visual Tips - vaccination infographic
Tutorial on how to create an attractive vaccination infographic with scientific illustrations on Mind the Graph, the infographic maker for scientists and academics. We turn scientists into designers to boost their impact! If you liked the video, access Mind the Graph…Read more
wave

Personal protective equipments (PPE): how important are they to prevent exposure to highly infectious diseases like coronavirus Covid-19

Fabricio Pamplona Coronavirus April 13, 2020
Do you know how important the personal protective equipments (PPE) are to prevent exposure to infectious disease vectors? A lot. The type of EPP that you use basically depends on your intention of use and area of work. If you…Read more
wave

Debunking the Top Myths About the Coronavirus (COVID-19)

Fabricio Pamplona Coronavirus, Infographic March 30, 2020
Covid-19 template
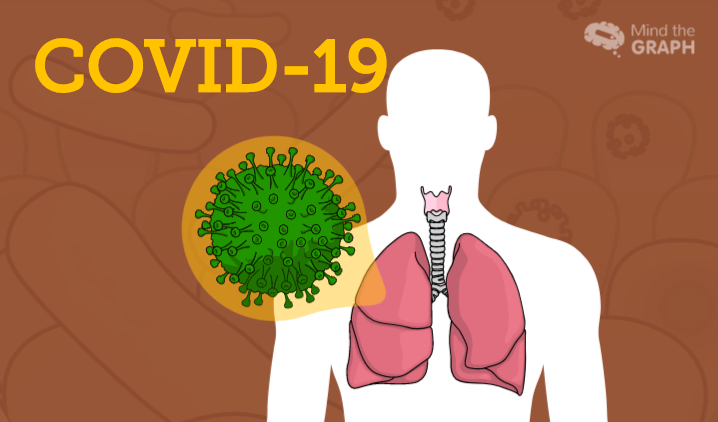
The world is facing a major health crisis. Amid the novel Coronavirus pandemic, the first step to guaranteeing the safety of you and your loved ones is to stay fully informed of the disease. Since the internet is saturated with…Read more
wave

How to create professional presentations for scientific conferences

Fabiola Soares Tutorials February 5, 2020
Conferences, seminars and presentations are very common in a researcher routine. But you probably already know that. However, as we have always a lot of lab work to do, it isn’t easy to find time to create an attractive and…Read more
wave

Create beautiful scientific
infographics with no effort

We turn scientists into designers to boost your impact. Globally.

Try for free
TRUSTED BY
© 2019, Gutentim. All Rights Reserved