Science communication has long been an issue due to the many obstacles between the complex scientific knowledge and the readers. Sometimes, a subject is so complex that it requires specific previous information even to understand the title.
We believe that it is of the best interest of scientists and readers alike to communicate science in a way that is more attractive and can be better understood, circumventing the language barriers, being it due to the difficulty in foreign languages or scientific jargon itself.
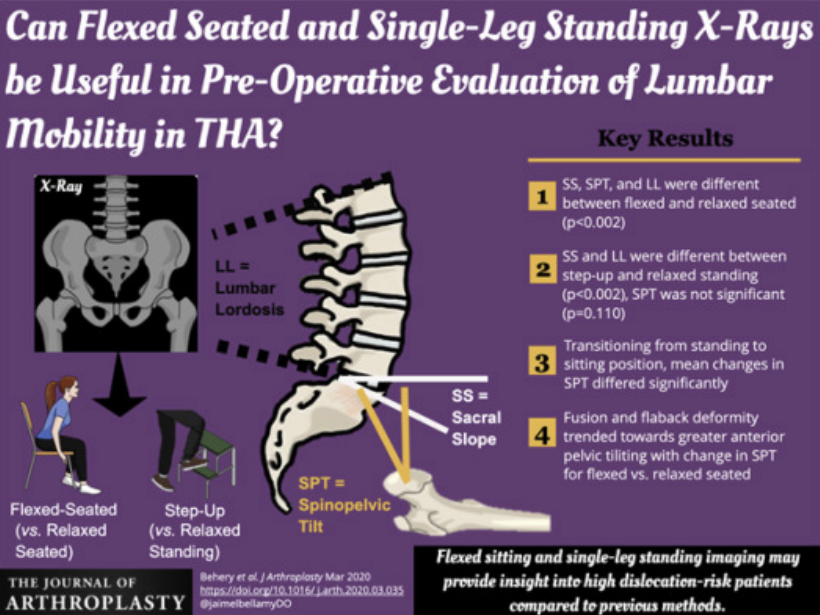
You may have heard of infographics, this appealing way of “telling a visual story” while communicating good consistent scientific data. If you have not heard before, the time has come.
The power of visual to communicate science
Visual communication has long been perceived as the best way to communicate complex topics, where images may speak more than words. This is also true in topics published in scientific papers, where a wall of words – full of jargon – is placed between the reader and the content, which is normally complex in itself.
Science-related subjects are often hard to read, starting on the very first paragraph. In some cases, people don’t even understand the title of a research paper, need not mention complicated formulas or technical speech. On another layer, authors and readers alike don’t have English as their primary language. All in all, it makes science communication a true challenge in the international context.
Visual design can help bridge this science communication gap with the use of infographics. In this niche, you’ll probably recognize them as “science figures”, “diagrams” or “graphical abstracts”, but I’ll let you know what they are and why you – as a scientist – should try to learn this language as soon as possible to attract more readers to your papers.
Infographics have evolved in recent years to be useful tools for dissemination of complex content, like science-related ones, because they can easily simplify the communication using visual elements. They rely on the human visual-cognitive ability to recognize patterns and trends, reading more promptly when the text has visual aids, like icons, charts and attractive-informative science illustrations.
Wanna have more readers? There are already a few studies of meta-science defining how the use of visual design is boosting science communication, let me show you.
Relevant recent articles on visual scientific communication:
- Considerations for effective science communication
- A picture is worth a thousand words in medical writing
- Scientific communication: the art of preparing and presenting scientific results
- A Picture Is Worth a Thousand Views: A Triple Crossover Trial of Visual Abstracts to Examine Their Impact on Research Dissemination
- A Crossover Randomized Trial of Visual Abstracts Versus Plain-Text Tweets for Disseminating Orthopedics Research
- An Integrated Guide for Designing Video Abstracts Using Freeware and Their Emerging Role in Academic Research Advancement
- Preparing Infographics for Post-publication Promotion of Research on Social Media
Extra visibility and engagement just by using visual elements in science communication
In the article “Considerations for Effective Science Communication“, infographics are highlighted as one of the main elements of practical science communication strategies that you should consider to stand out while communicating science to a mass audience.
One of the tools recommended to create science infographics in the article is Mind the Graph, you’ll see more about it in this post. //
As quoted from the article by Dr. Steven J. Cooke and colleagues: “(…) peer-reviewed articles are seen as highly credible sources to scientists, but others find them difficult to access and interpret. If you coordinate the publication of a new research paper with an accompanying infographic, blog post, video summary, Twitter campaign, or press release, news of your research can reach a much larger audience while maintaining the credibility of peer review”.
According to a study by “The Economist”, the number of citations increased 120% when a research paper included an infographic. The importance of diagrams to science cannot be completely grasped by this number alone.
In fact what we see is that a good visual in a research paper is presented and shared over and over in university papers, thesis, articles, informal talks, posters and conference presentations.
The reach of a paper that present its findings with well-crafted visual elements is far beyond the strict scientific community to where it belongs. Visual can help science disseminate over the walls of the Ivory Tower, as one would say.
At last, but not least, visual abstracts can help disseminate content in social media, a relatively new media to foster public awareness of science-related topics. Think about the whole dispute about the narrative around vaccines and you’ll realize the importance of science communication very quickly.
According to this study, tweets about scientific findings that contain a visual abstract had more than twice as many views and 5 times more engagement than citation-only tweets. In confirmation, another study found that visual abstracts increase engagement and information retention in an strategy of content dissemination in orthopedic surgery, as reported by the publication of the American Association of Hip and Knee Surgeons (AAHKS).
An infographic maker for scientists: how was Mind the Graph created?
Ok, visuals are great and every active scientist has already realized that graphical abstracts (or visual abstracts) are trendy in science communication. But here comes the problem: how should one create visual representations of its scientific findings without proper training or professional resources to do that?
Science communication is not a discipline taught in most of the science-related courses, and more often than not, researchers lack appropriate design skills or access to professional softwares. That’s the gap we wanted to fill with Mind the Graph: we turn scientists into designers and unlock creativity with all visual resources needed for effective science communication.
Mind the Graph is the best alternative to the time wasted looking for images in Google and painstakingly assembling them in PowerPoint for the “best possible” result – which is never good enough to look professional, by the way.
To create professional-looking science images for a publication, you need:
- Images with consistent artwork style
- Scientifically-accurate illustrations
- Layouts with intuitive reading flow
- Charts, symbols and icons
- Appropriate font styles
You find it all in Mind the Graph, because it was created with the scientists’ needs in mind. Forget about the time when the science figure you created for a publication was a reprehensible compilation of several images “stolen” from the internet, each one with a different style.
Combining one 3D image together with a 2D, a handwriting sketch and/or Cliparts of Microsoft’s icons simple will never look good enough to stand for the quality of your professional work.
Let me introduce you to Mind the Graph and, believe me, those days are gone. With access to this tool and all available resources you will find yourself questioning if it makes any sense not to use it for anything you create in visual communication in a scientific context.
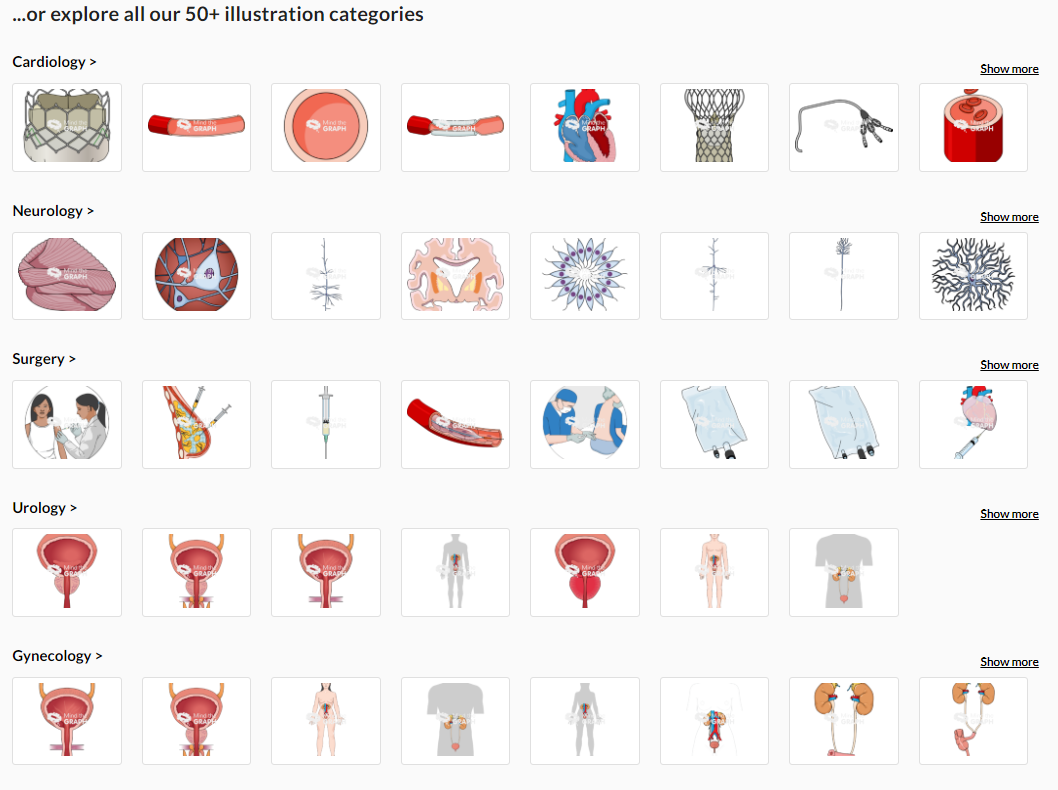
Before you ask: yes, all fields of science are welcome and you can find tens of thousands of illustrations in the database. If you eventually don’t find something you need, you can just ask for it!
Freelance designers are no longer needed
Some scientists already felt the urge to create visual pieces of science communication and simply could not or didn’t have time to do it. It normally comes in the shape of a graphical / visual abstract requested by a publication, a scientific magazine cover or that special presentation for a conference. If that’s your case, don’t feel bad, it’s more common than you think.
Truth is that on top of raising money, performing experiments, writing grants, papers and reports, scientists are now pushed to do science communication. Not everyone is ready for that, but it’s a trend that came to stay. So… better be ready.
When faced with this issue, a lot of people end up hiring freelance designers to help. The problem is that freelancers are rarely used to illustrate science-related topics, so, instead of wasting time searching in Google, you’ll find yourself wasting time explaining science to a lay person, without visual resources, which makes it even harder.
It’s a stressful back and forth that we want to help you get rid of with Mind the Graph. Need dedicated design service? We have it. Any illustration you need, just request it from our team and it will be ready in a flash.
Any graphical abstract, presentation or special art? We have you covered. And our people understand science… So, no struggle at all. We ensure a smooth process throughout.
And the best part of it: it’s all delivered through Mind the Graph platform, hassle-free and ready to be edited, whenever you need. Don’t need to rely anymore on external services for simple tweeks in the text or the image after the reviewer’s suggestion.
Mind the Graph also provides an artificial intelligence (AI)-powered tool that can help you solve another frequent problem in visual science communication: posters for conference.
If you haven’t seen the Poster Maker yet, I would try to do it right now and start saving time (and money). It’s simply the best tool for creating a whole poster out of any published paper or conference abstract in a few clicks.
I bet you won’t be that desperate scientist looking for a freelance designer to help design a poster, create a graphical abstract or science figure anymore, Mind the Graph has it all for you. Just come by and check our products and services.
Mind the Graph free culture licenses: what you create is truly yours
In the scientific publishing industry, authorship rights are usually transferred from author to the publisher upon acceptance of a paper. Book and paper publishers are creators, owners and users of intellectual property rights obtained from the authors.
They possess certain rights in the publications they produce and sell, and they hold other rights on behalf of third parties. In this particular case, from the scientists.
This is all defined in the copyright transfer agreement you normally receive from the editor right after your paper is accepted. If you are into it, I suggest researching this insightful Wikipedia article about intellectual property.
The author rights you need to retain to sign a copyright transfer agreement is the main reason why you simply cannot just go search on the internet and “grab” (to say the least) figures from the internet for your publication. When you’re writing a proper original publication, you need to actually hold the rights over that images to be able to transfer to the publisher.
Several scientific societies and conference organizers are starting to think the same about poster and presentations, realizing that authors cannot present someone else’s content, particularly without referring to the original source.
That’s one of the main problems solved by Mind the Graph: we provide the means, but anything you create on the platform is truly yours. All the illustrations and assets you access in the platform are offered via Creative Commons licenses of use, and you’re free to copy, edit, reassemble and create your own science figures in Mind the Graph platform.
In other words: you can unlock your creativity with professional assets in a familiar user-friendly platform and don’t need to be worried about author rights when submitting your paper to a scientific publisher.
Mind the Graph gets rid of all the difficulties related to the design of scientific images, allowing you to transfer author rights to publishers. Importantly, since the platform has a free version, in this you’ll need to keep the watermark in images and mention the website in the acknowledgment section of your paper. It’s fair, isn’t it? Otherwise you may decide to upgrade to the paid version and use watermark-free scientific illustrations.
Here is why you should try Mind the Graph right now
We can ensure that Mind the graph is the tool you need to communicate science visually, attract more readers and stand out from other authors. There is a reason why we have an average evaluation of 4.6/5.0 in the reviews.
Empower authors to create great content by themselves:
- Intuitive drag and drop interface for content production
- World’s largest gallery of scientifically accurate illustrations
- One-click illustration customization with 5 artwork styles
Here is a short list of the reasons why you should start using Mind the Graph right now:
- Find all the illustrations you need to create awesome science figures
- Never waste time again looking for visual content in Google
- Rely on professional designers to guide you with special templates
- All the features you need in an intuitive drag-and-drop interface
- Many formats are available, including graphical abstracts, slides and posters.
- Download everything in high resolution directly to the publisher!
- There’s a free version available, and you can save lots of money in the subscription since it’s included in the Researcher.Life platform.
The 10 most relevant product details in this short 1.5 min video:
- Illustrations search engine that improves with experience
- The right composition elements to create awesome images
- Unique style and one-click customizations
- Ethnic variations of the human body
- Different strains of laboratory animals
- Use professional vector-based illustrations
- Database with 110 million molecules to include
- Over 100 relevant templates for the formats you need
- Include modern stylish charts to show your data
- Made by scientists for scientists (scientifically accurate)


Subscribe to our newsletter
Exclusive high quality content about effective visual
communication in science.
