In the last couple of years, the number of journals that request a graphical abstract to submit a paper has increased, which is expected because communicating science through a visual way has become each day more essential, for better understanding and comprehension.
Today, each journal has different rules (or no rule at all) for science figures (graphical abstracts, visual abstracts, or infographics), which can make us a little lost to decide what to do and how to do it.
So, we decided to present you with this guide of How to make a graphical abstract for Elsevier publishing.

Adding a graphical abstract to your research can increase significantly the chances of your work be seen.
It has already been proven by studies that articles that have science figures have a higher number of views and activities (shares and repost) on social media. In addition, the annual average use of an article is two times higher if it has a visual abstract.
That is amazing, right? That is exactly what we want! To increase our research and work impact, reaching more people, inside and outside the academic world.
Elsevier graphical abstract rules
In general, a summary from what’s expected of a graphical abstract by Elsevier:
“A graphical abstract should allow readers to quickly gain an understanding of the take-home message of the paper and is intended to encourage browsing, promote interdisciplinary scholarship, and help readers identify more quickly which papers are most relevant to their research interests.”
What is a graphical abstract?
In turn, abstracts are essentially a short summary of your research paper, usually 250 words long, with the purpose to describe your problem, methodology, results, and conclusion.
Even without a visual abstract, a well-written abstract allows readers to understand quickly what your research is about, hence acting as a hook to your audience, capturing their attention, and making them read the whole paper.
That is why your graphical abstract is the visual representation of your abstract; They share the main idea of your paper.
This is how Elsevier defines “graphical” or “visual abstract”:
“This is a single, concise, pictorial and visual summary of the main findings of the article.”
In other words, the graphical abstract that you will create must be the visual representation of your paper abstract.
Your visual abstract must give a quick overview of your work or as Elsevier would say:
“It could either be the concluding figure from the article or better still a figure that is specially designed for the purpose, which captures the content of the article for readers at a single glance.”
With that being understood, let’s dive into how to do it…
Creating a graphical abstract using Mind the Graph
One important point is that your graphical abstract should be unique, you should have your own graphical abstract for your work, an original figure, never seen or shared before.
Or as Elsevier would say:
“Authors must provide an original image that clearly represents the work described in the paper. […] Please note that, just as each paper should be unique, so each graphical abstract should also be unique.”
And this is where Mind the Graph comes to help you.
On our platform, you will find all the necessary tools to create your graphical abstract. It goes from start-from templates and illustrations to request a personalized illustration, plus all complementary available tools.
In the video below, you can see step by step how to create your graphical abstract for Elsevier using Mind the Graph.
Tutorial: How to make a graphical abstract to Elsevier publishing
Final Instructions to create a graphical abstract for Elsevier
Having always in mind what we mentioned before about what content your graphical abstract should have, now, we are going to see the final instructions for an Elsevier graphical abstract.
All the instructions were referenced from the Elsevier website here.
Set the image
A graphical abstract should be one image file to help visualize a single process in a clear and descriptive way. It must have a title and/or three different arguments. Another option would be an introduction, a methodology, and an outcome. It is up to you to choose which one is the best option for your case.
Organize the information
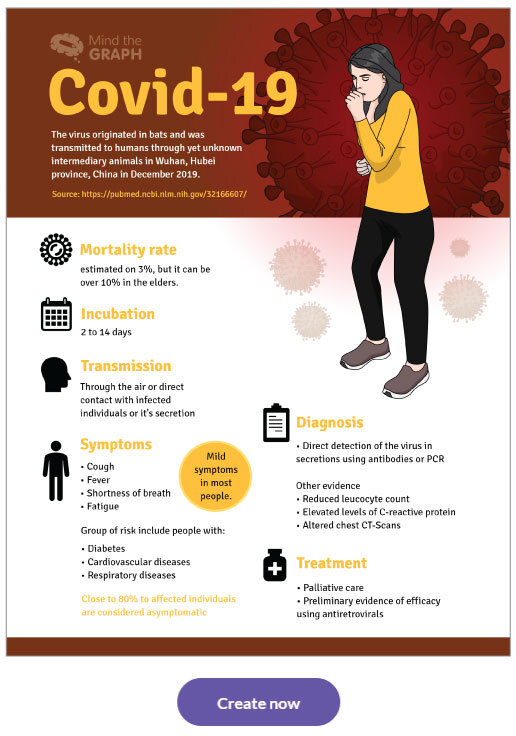
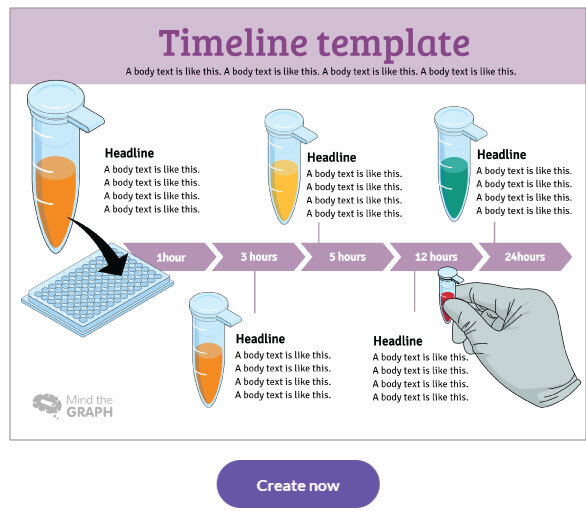
For ease of browsing, the graphical abstract should have a clear start and end. Preferably “reading” from top to bottom, and left to right.
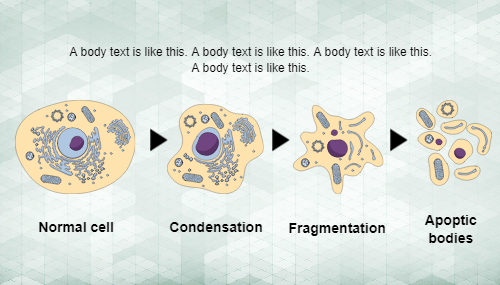
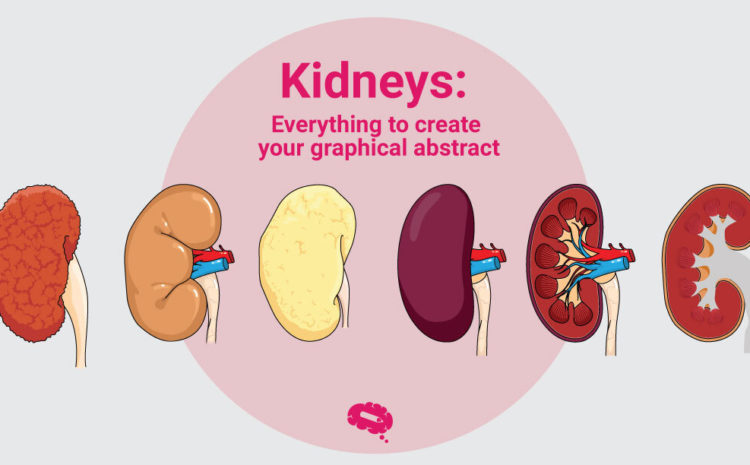
Check out these two templates from Mind the Graph, for example. All information is organized from top to bottom, from left to right. In addition, here you can find more graphical abstracts to aid your understanding.
Define the elements
One important tip is to try to minimize distraction and remove cluttering elements as much as possible.
Every element in your visual abstract must contain a reason and a why is there. Never add elements just to fill some blank. Plus never leave a blank space, try to organize your ideas using all space available.

Nail the details
Now, the details about image size, font to use, and file type are listed below:
- Image size: Please provide an image with a minimum of 1328 x 531 pixels (w x h) using a minimum resolution of 300 dpi. If you are submitting a larger image, please use the same ratio (500 wide x 200 high). Please note that your image will be scaled proportionally to fit in the available window on ScienceDirect: a 200 by 500-pixel rectangle.
- Font: Please use Times, Arial, Courier, or Symbol with a large enough font size as the image will be reduced in size for the table of contents to fit a window 200 pixels high.
- File type: preferred file types are TIFF, EPS, PDF, or MS Office files.
In addition, no additional text, outline, or synopsis should be included. Any text or label must be part of the image file. Please do not use unnecessary white space or a heading “graphical abstract” within the image file.
That’s it, science people! That is all you need to know to design a graphical abstract for your Elsevier paper.
Besides all of the above, ensure to read the guides for authors of the journal in question before finalizing your work, a few details could be different from journal to journal.
To know more about abstracts, here’s an abstract writing ppt for further reading, and you can find the Elsevier abstract submission guidelines here, and Elsevier abstract format in this link.
And if you want to keep creating effective graphical abstracts in general check out this other article: How to create an effective graphical abstract .
Are you already a Mind the Graph user?
Click the button below to start your creation right now!


Subscribe to our newsletter
Exclusive high quality content about effective visual
communication in science.