
Welcome to the Mind the Graph Experience!
This is the first article of a series that will share artworks (aka science figures) made by our users in the Mind the Graph platform.
Even though there are today many tools that help us create a professional figure is still hard to put ideas on paper, especially when it comes to science figures.
For that reason, to help you to break some walls inside your head, we decided to share with you some science figures references.
Yes, references!
To produce a science figure (just as everything else in our lives) we need references. We need to see examples of figures to be able to visualize in our minds what concept we want to share and how we are going to share it.
Therefore, we decided to do this gathering to inspire you.
We, from Mind the Graph, are going to show you in this new blog post category, how our Mind the Graph’s users utilize the platform to create their science figures, plus their testimonials about how the platform changed their lives.
You will see here science figures (infographics and graphical abstracts) from published papers and different research fields to inspire you to create your professional science figure, for your research. And more, a brief explanation about how they communicate their research with science figures
We are constantly saying that you already have everything you need in your mind for your breakthrough, the platform only gives you the tools.
The Mind the Graph’s work-space is designed to be intuitive, simple to use, and fluid, so that in the end, optimizes your (user) time.
We want you to be able to create everything and anything that comes to your mind.
MTG has the largest library of illustrations available and you can use as many illustrations as you need. Beyond that, the beautiful illustration design will certainly make your work stand out.
Alright, now let’s get right to business!

Published by the Journal of Pharmacy and Pharmacology, Figueira and colleagues, designed and added to their article the science figure below. Check it out!
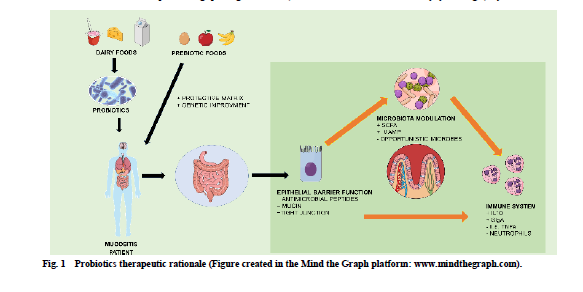
The article discusses the use of selected strains of probiotics to treat mucositis, an inflammatory condition caused by radiotherapy and chemotherapy drugs. Today, a considerable number of patients develop the condition due to their cancer treatments, and there is not yet a successful way to treat or prevent it. The high level of apoptosis of intestinal cells caused by the radiotherapy and chemotherapy drugs, cause the loss of the epithelial barrier of the gut, turning the exposed area susceptible to parasite microbes, which in turn, can induce other health problems to the patient, like ulcer, or even the systemic circulation of the microbe. However, dairy origin probiotic strains showed themselves as a potential option of treatment and prevention of mucositis, being able to control several intestinal factors. The benefits include the help to sustain the mucus barrier and intestinal permeability of the gut, the exclusion of pathogenic bacterias, modulation of immune signaling molecules, and prevention against apoptosis and oxidative damage.
As you can see, this brief explanation of the article is present in the science figure. They capture all the major information in the paper and display it visually. We surely can get what the article is about just by looking at it.
Very cool, right?
In another paper published in the IntechOpen, Current Topics in Malaria in 2016, Souza and her team decided to add more than one science figure to their work. The combination allowed the readers to understand quickly important points of the research.
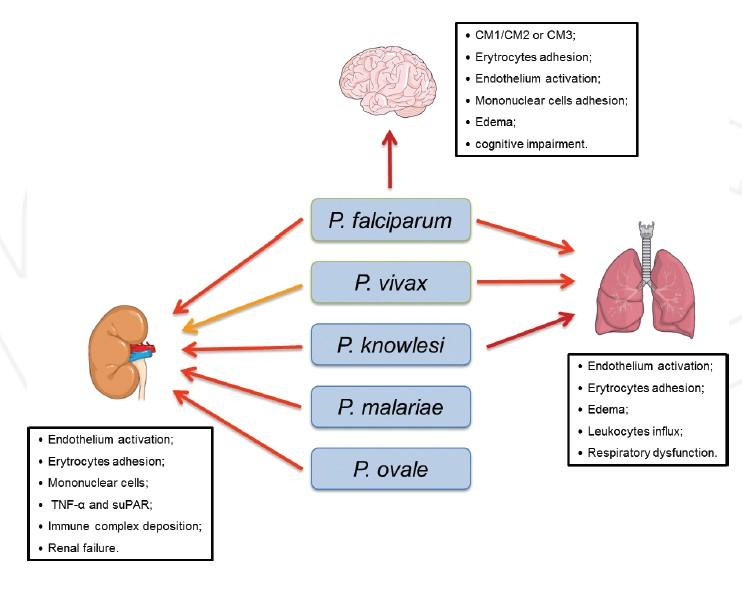
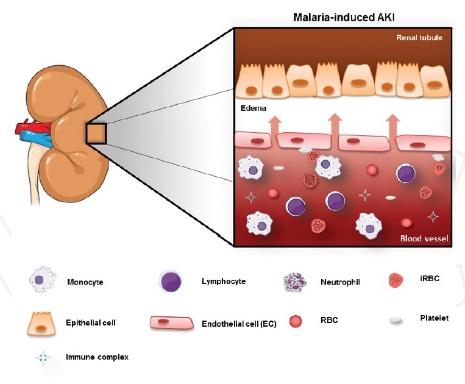
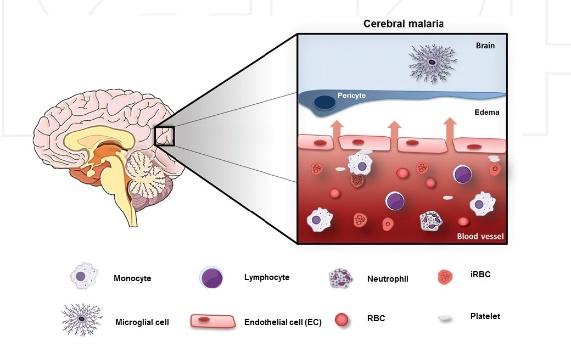
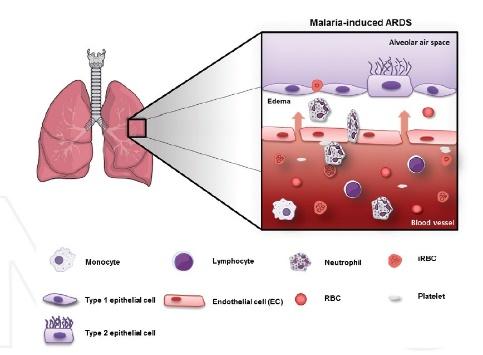
The article had the purpose to study how inflammatory responses in severe malaria affect multi-organ dysfunction, focusing on lungs, kidneys, and brain. The researchers found out that membrane-proteins expressed by the protozoa, act as a trigger to the inflammatory response and each organ has its specific response due to different anatomical and physiological characteristics, leading sometimes to organ dysfunction.
The authors designed one science figure for each organ studied, plus a graphical abstract gathering the study highlights. The science figure is self-exploratory, with keywords, plus accurate and informative illustrations from the Mind the Graphs platform – all the prerequisites to capture readers’ attention.
And last but not least, available in the Clinical and Experimental Pharmacology and Physiology journal, the authors of the article added to their text work a wonderful science figure showing a representative scheme of their hypothesis and the protocol used in the methodology.
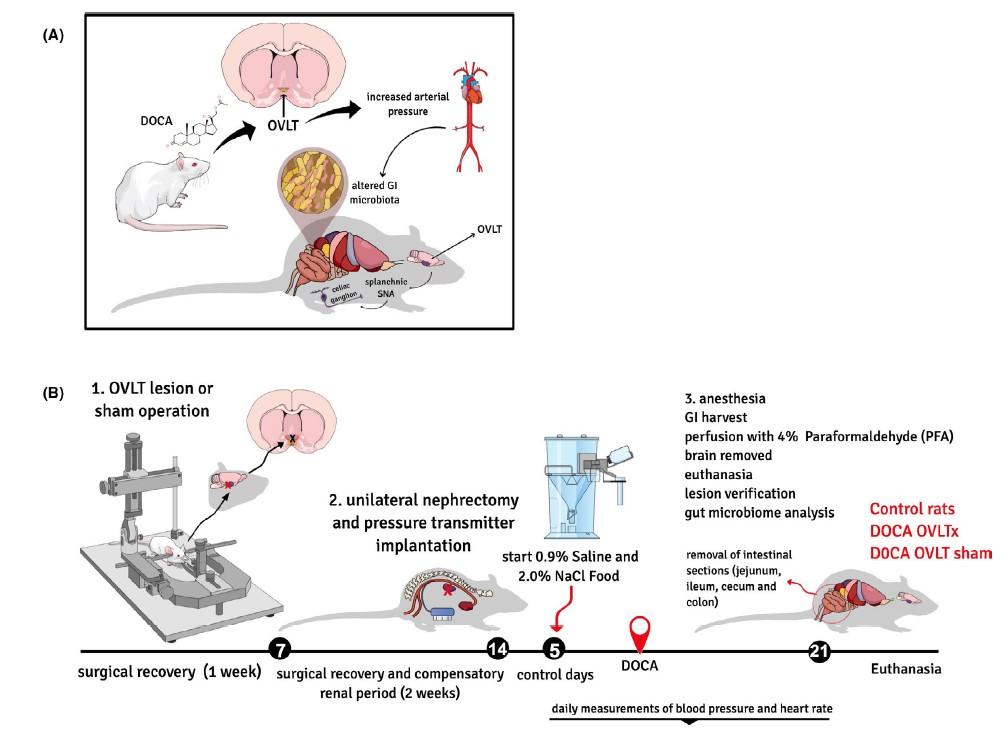
The article discusses and unfolds a recent association theory between the composition and activity of gastrointestinal microbiota and hypertension. Researchers submitted adult male rat’s into a five steps experimental protocol: The rats had surgery to get specific brain areas injured, then, after a few days, they had another type of surgery. Then, after recovering, it was given a chosen diet and drinking solutions. After a period of observation and data collection, the rats were euthanized, and certain regions of the intestinal tract were removed and frozen for analysis.
In the science figure above, accurate illustrations allowed us, the readers, to understand the study, and even further, to see important details about the research.
Nayara Pestana-Oliveira, the first author of the article, shared with us, from Mind the Graph, a testimonial about her experience with the platform. Take a look at her message and how the platform helped to change the visual of her work.
“So, I use the platform to make illustrations like graphical abstract, experimental design, and hypothesis. Sometimes I needed something and I didn’t have exactly the illustration I wanted. So I asked and it was taken care of. There are a wide variety of options. But I still miss more specific things, mainly related to animal models not linked to behavior. My line of research involves female reproduction and hypertension, both in animal models. The platform meets my needs and has improved considerably. My works have been praised and gained an identity.”
We are very glad to know that, Nayara!
And just like Nayara did, you too can request a specific illustration and our team of designers will do the design especially for you. Click here to see how to request an illustration.
We love to see testimonials like this, and how researchers from all over the world discovered new ways of explaining their work, improving their visual communication.
We hope that all the science figures references in this post had inspired you to innovate and do things differently in your next project.
Mind the Graph’s purpose in this world is to untangle science through visual and creative links. Equipped with a huge library of illustrations and templates, we want to inspire scientists to run away from the regular and lose the common, exploring a completely new world of possibilities and turn possible all the creations and ideas inside your mind!
Are ready to start your creation?
Click here to start!
Articles mentioned:
FLÁVIA FIGUEIRA ABURJAILE et al. Wild-Type and Genetically Improved Strains of Dairy Origin Probiotic as Potential Treatments for Intestinal Mucositis – 1. Journal of Pharmacy and Pharmacology, v. 7, n. 4, 8 abr. 2019.
PESTANA‐OLIVEIRA, N. et al. DOCA-salt hypertension and the role of the OVLT-sympathetic-gut microbiome axis – 3. Clinical and Experimental Pharmacology and Physiology, v. n/a, n. n/a, [s.d.].
SOUZA, M. C. DE; PÁDUA, T. A.; HENRIQUES, M. DAS G. Multiple Organ Dysfunction During Severe Malaria: The Role of the Inflammatory Response – 2. Current Topics in Malaria, 30 nov. 2016.


Subscribe to our newsletter
Exclusive high quality content about effective visual
communication in science.
